.svg)

- GraalVM 25.4 (Innovation)
- GraalVM 25.0 (LTS)
- GraalVM for JDK 21 (LTS)
- GraalVM for JDK 17 (LTS)
- Archives
- Dev Build
Debug Adapter Protocol
GraalVM supports debugging of guest language applications, written in any of the supported languages (JavaScript/TypeScript, Python, R, or Ruby), and provides a built-in implementation of the Debug Adapter Protocol (DAP). By definition, Debug Adapter Protocol is to standardize the “communication” between the debugging component and a concrete debugger or runtime. This allows you to attach compatible debuggers such as Visual Studio Code (VS Code) to GraalVM.
To open a debugger port serving Debug Adapter Protocol, you need to pass the --dap option to the command line launcher.
The usage of Debug Adapter Protocol is similar to the existing Chrome DevTools Protocol implementation in the GraalVM runtime:
--dap.Suspend=false: disable the execution suspension at first source line, enabled by default.--dap.WaitAttached: do not execute any source code until debugger client is attached. The default is false.--dap=<[[host:]port]>: start the debugger on a different port than default (<host>:4711).
Then you need a DAP client to connect to the open DAP port. VS Code will be used as an example.
1. Save this Node.js application in a file named App.js:
const express = require('express')
const app = express()
const port = 3000

app.get('/', (req, res) => {
  res.send('Hello World!')
})

app.get('/neverCalled', (req, res) => {
  res.send('You should not be here')
})

app.get('/shutdown', (req, res) => {
  process.exit();
})
app.listen(port, () => console.log(`Example app listening on port ${port}!`))
2. Install the express module dependency in the directory where you saved the file:
$JAVA_HOME/bin/npm install express
3. Run the application with DAP enabled:
$JAVA_HOME/bin/node --dap App.js
[Graal DAP] Starting server and listening on localhost/127.0.0.1:4711
4. Start VS Code, freshly installed without any extensions:
code .
5. Open the App.js source in VS Code, and put a breakpoint, for example, at line 6 (res.send('Hello World!')).
6. Navigate to View > Run to create a launch configuration (Ctrl+Shift+D):
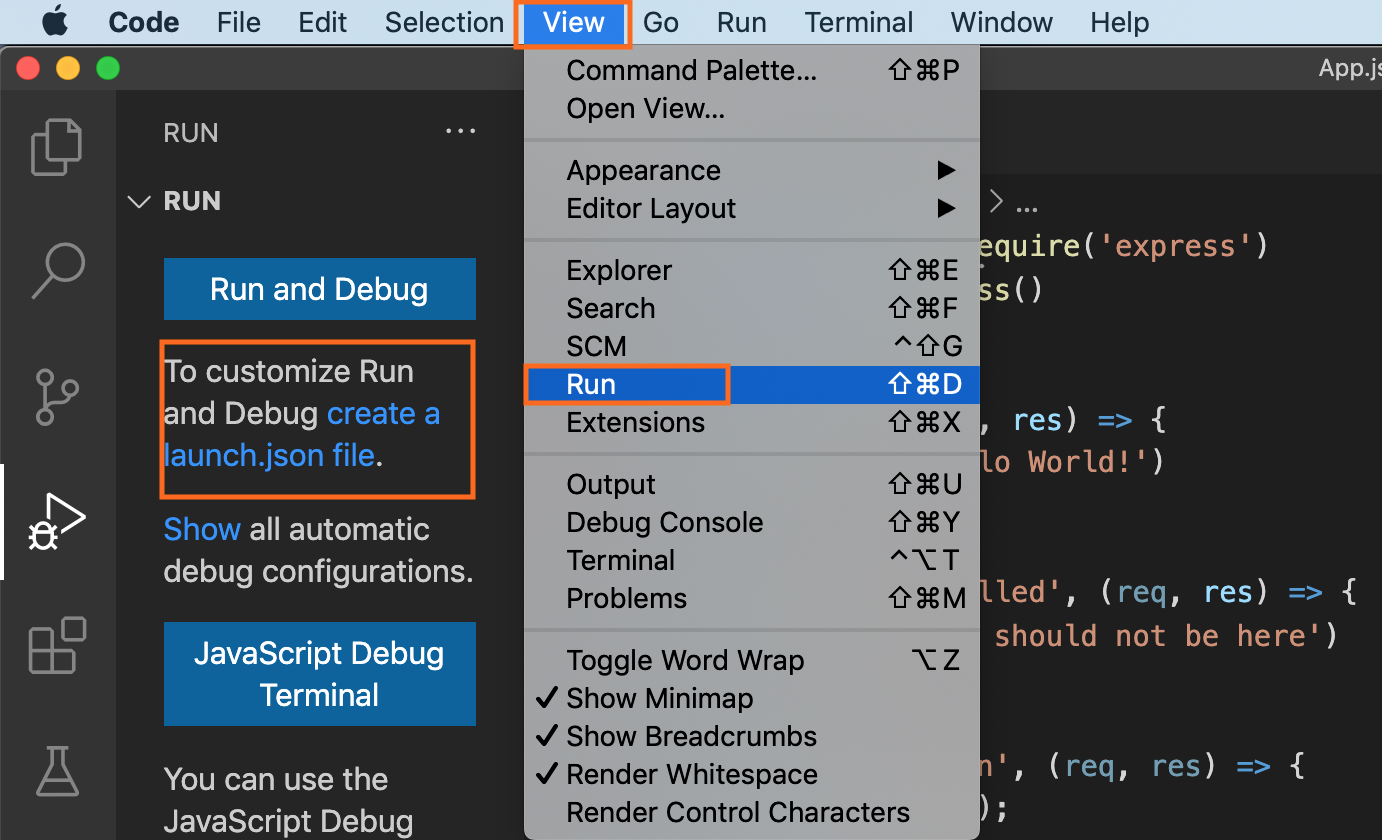
7. Then create the launch.json file with the following content:
{
    "version": "0.2.0",
    "configurations": [
        {
            "name": "Attach",
            "type": "node",
            "request": "attach",
            "debugServer": 4711
        }
    ]
}
8. Start debugging (F5).