- GraalVM 25.1 (Innovation)
- GraalVM 25.0 (LTS)
- GraalVM for JDK 21 (LTS)
- GraalVM for JDK 17 (LTS)
- Archives
- Dev Build
Chrome Debugger
GraalVM supports debugging of guest language applications and provides a built-in implementation of the Chrome DevTools Protocol. This allows you to attach compatible debuggers such as Chrome Developer Tools to GraalVM.
To debug guest language applications, pass the --inspect option to the command line launcher, as in the following example with a Node.js HelloWorld program:
var http = require('http');

var server = http.createServer(function (request, response) {
  response.writeHead(200, {"Content-Type": "text/plain"});
  response.end("Hello World!\n");
});

server.listen(8000);

console.log("Server running at http://localhost:8000/");
- Save this program as
HelloWorld.jsand then run:$JAVA_HOME/bin/node --inspect HelloWorld.js Debugger listening on ws://127.0.0.1:9229/SBqxI5YIqtREaDrXkFr8hLE0HL1AfKx8TjkI8qPMq2s For help, see: https://www.graalvm.org/tools/chrome-debugger For example, in Chrome open: devtools://devtools/bundled/js_app.html?ws=127.0.0.1:9229/SBqxI5YIqtREaDrXkFr8hLE0HL1AfKx8TjkI8qPMq2s -
Navigate to
http://localhost:8000/in your browser to launch the node application. -
Open the
devtools:...link in a separate Chrome browser tab. -
Navigate to the
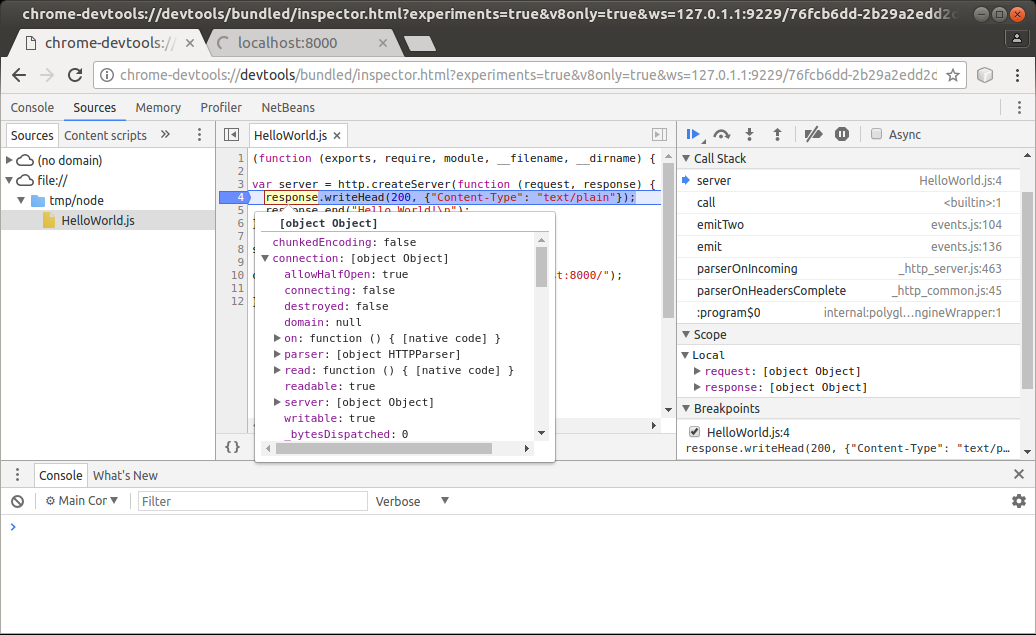
HelloWorld.jsfile and submit a breakpoint at line 4. - Refresh the node.js app and you can see the breakpoint hit.
Now you can inspect the stack, variables, evaluate variables, and selected expressions in a tooltip, and so on. By hovering your cursor over the response variable, for instance, you can inspect its properties, as seen in the screenshot below:
Consult the JavaScript Debugging Reference for details on Chrome DevTools debugging features.
This debugging process applies to all guest languages that GraalVM supports. Other languages such as R and Ruby can be debugged as easily as JavaScript, including stepping through language boundaries during guest language interoperability.
Inspect Options
Node Launcher
The Node.js runtime of GraalVM accepts the same options as node.js built on the V8 JavaScript engine, such as:
--inspect[=<port number>]
This enables the inspector agent and listens on port 9229 by default. To listen on a different port, specify the optional port number:
--inspect-brk[=<port number>]
This applies to the node launcher only.
Other Language Launchers
Other guest language launchers such as js, python, Rscript, ruby, lli, and polyglot accept the --inspect[=<port number>] option, but suspend on the first line of the application code by default.
--inspect.Suspend=(true|false)
This disables the initial suspension if you specify --inspect.Suspend=false.
Additional Common Inspect Options
All launchers also accept the following additional options:
--inspect.Path=<path>allows users to specify a custom path that generates the connection URL. Note: any website opened in your browser that has knowledge of this URL can connect to the debugger. A predictable path can thus be abused by a malicious website to execute arbitrary code on your computer, even if you are behind a firewall. Therefore the path is randomly generated by default.--inspect.SourcePath=<source path>specifies a list of directories or ZIP/JAR files representing the source path. When the inspected application contains relative references to source files, their content is loaded from locations resolved with respect to this source path. It is useful during LLVM debugging, for instance. The paths are delimited by:on UNIX systems and by;on MS Windows.--inspect.WaitAttached=(true|false)when true, no guest language source code is executed until the inspector client is attached. Unlike--inspect.Suspend=true, the execution is resumed right after the client is attached. This assures that no execution is missed by the inspector client. It isfalseby default.--inspect.SuspensionTimeoutsets a timeout of a debugger suspension. The debugger session is disconnected after the timeout expires. The timeout value consists of a positive integer value followed by a chronological time unit. For example, ‘15m’ or ’10s’. Valid time units are ‘ms’ for milliseconds, ‘s’ for seconds, ‘m’ for minutes, ‘h’ for hours, and ‘d’ for days. There is no timeout set by default.
Advanced Debug Options
The following options are for language experts and language developers:
--inspect.Initialization=(true|false)when true, this option inspects the language initialization phase. When initial suspension is active, this suspends at the beginning of language initialization, not necessarily at the beginning of the application code. It isfalseby default.--inspect.Internal=(true|false)when true, internal sources are inspected as well. Internal sources may provide language implementation details. It isfalseby default.
Programmatic Launch of Inspector Backend
Embedders can provide the appropriate inspector options to the Engine/Context to launch the inspector backend.
The following code snippet provides an example of a possible launch:
import org.graalvm.polyglot.*;

class DebuggerSample {
    public static void main(String... args) {
        String port = "4242";
        String path = java.util.UUID.randomUUID().toString();
        Context context = Context.newBuilder("js")
                    .option("inspect", port)
                    .option("inspect.Path", path)
                    .build();
        String hostAdress = "localhost";
        String url = String.format(
                    "chrome-devtools://devtools/bundled/js_app.html?ws=%s:%s/%s",
                    hostAdress, port, path);
    }
}
When running on OpenJDK, the following Maven dependencies must be declared to use the Chrome Inspector tool with embedded code:
<dependency>
    <groupId>org.graalvm.polyglot</groupId>
    <artifactId>polyglot</artifactId>
    <version>${graalvm.polyglot.version}</version>
</dependency>
<dependency>
    <groupId>org.graalvm.tools</groupId>
    <artifactId>chromeinspector</artifactId>
    <version>${graalvm.polyglot.version}</version>
</dependency>
The Chrome Inspector tool is always available as a tool on GraalVM. No dependency needs to be explicitly declared there.