◀Table of Contents
Debugging Native Executables
You can debug a native executable in a running state directly from within an IDE. This functionality is available from Visual Studio Code (VS Code) with the GraalVM for Java extension installed. You can experience a Java-like debugging of a native executable, set breakpoints, inspect the state of your application, even attach the debugger to a native executable process in VS Code and step over your Java application source code.
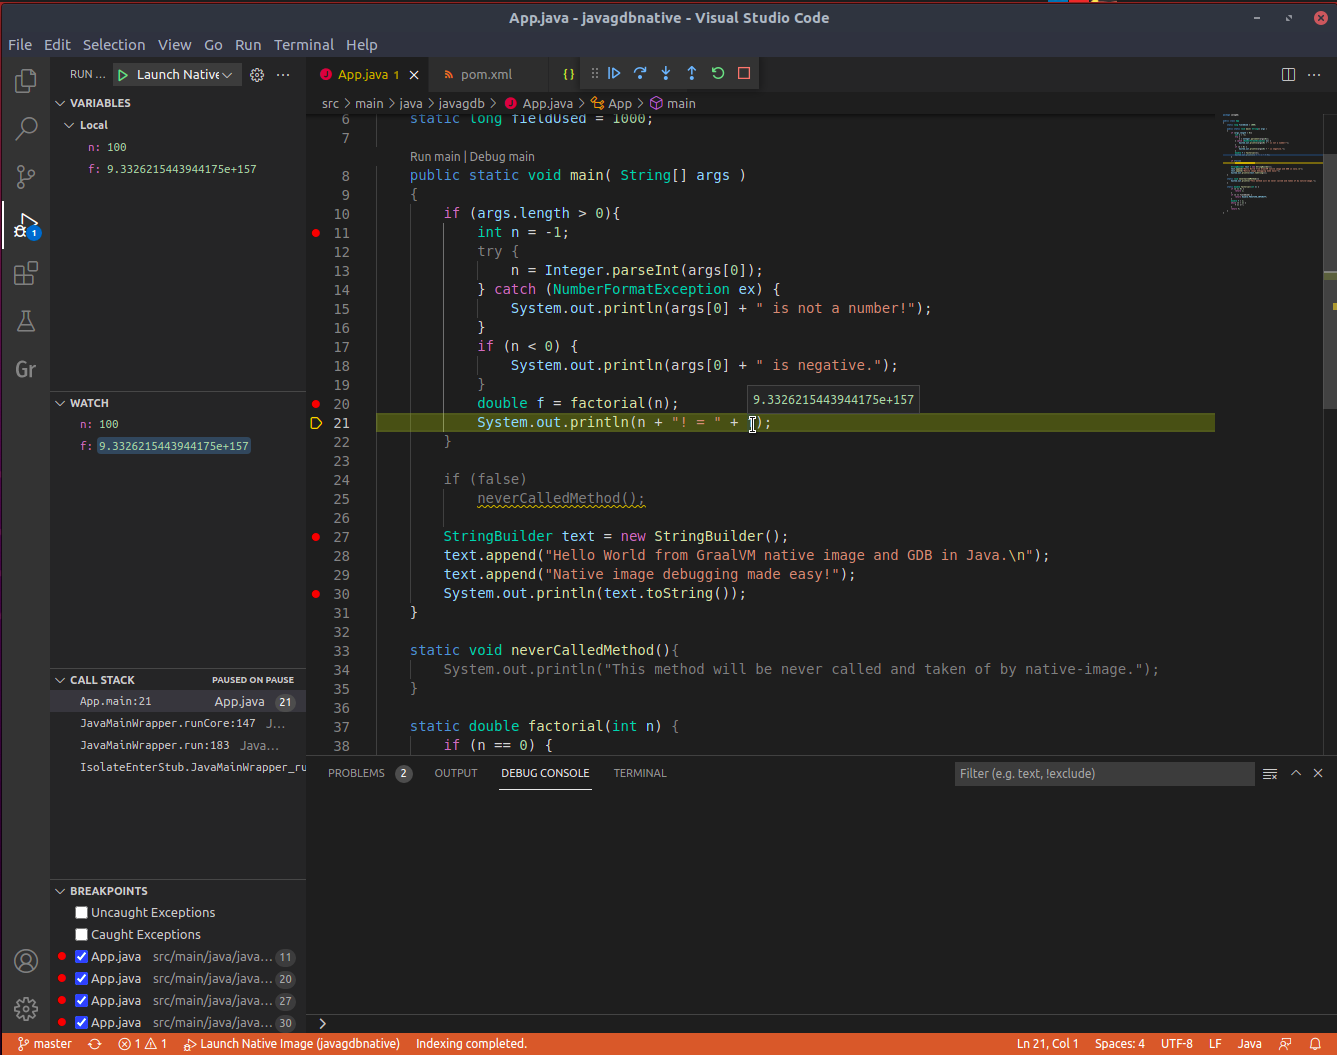
Learn more about Native Image debugging and run a demo from GraalVM for Java VS Code extension documentation.