◀Table of Contents
Debug Native Executables in VS Code
You can debug a native executable generated by GraalVM Native Image from the command line with the GDB bebugger, or from within Visual Studio Code (VS Code) by means of the GraalVM Tools for Java extension.
In this guide you will learn how to debug a Java application compiled into a native executable from VS Code.
To learn how to debug Java using GDB, see the dedicated Debug Native Executables with GDB.
Introduction
You can debug a Native Image process the same way as debugging a regular Java application: when your native executable is running, the debugger attaches to the application process, the Java source file is opened, letting you debug it. You can perform regular debugging actions like setting breakpoints, creating watches, inspecting the state of your application, etc.
Debugger attachment is enabled by adding a separate configuration, Native Image: launch, to the launch.json file.
Note: To debug a native image from within VS Code, you must install GraalVM Enterprise.
Prerequisities
- Linux OS with GDB 10.1
- VS Code
- GraalVM Extension Pack for Java installed in VS Code
- GraalVM Enterprise, set as a default Java runtime environment in VS Code
- Native Image
Create and Build the Demo
The demo is a simple Java factorial calculator that uses the Native Build Tools for GraalVM Native Image, which provides support for building and testing native executables using Apache Maven™ and Gradle.
The Maven pom.xml file is extended with a native profile, which makes building a native executable easier (read more about Maven Profiles here).
To add debug information, the <buildArg> tags are used in the native profile configuration to pass parameters to the native-image build process:
 <buildArg>-g</buildArg>
 <buildArg>-O0</buildArg>
The -g flag instructs native-image to generate debug information in a format the GNU Debugger (GDB) understands.
Then -O0 specifies that no compiler optimizations should be performed.
Disabling all optimizations is not required, but in general it makes the debugging experience better.
-
Clone the demos repository from GitHub and open the
javagdbnativefolder in VS Code:git clone https://github.com/graalvm/graalvm-demos.git -
In VS Code, open Terminal, then click New Terminal, and run following command:
mvn -Pnative -DskipTests packageThis command compiles and packages a Java application into a runnable JAR file and then uses GraalVM Native Image to generate a native executable from it. Once you have your executable with debug symbols generated, the next step is to add the debugger configuration, Native Image: launch, into the
launch.jsonfile in VS Code. -
Select Run Add Configuration… and then select Native Image: Launch from the list of available configurations. It will add the following code to
launch.json:{ “type”: “nativeimage”, “request”: “launch”, “name”: “Launch Native Image”, “nativeImagePath”: “${workspaceFolder}/build/native-image/application” }The value of the
nativeImagePathproperty has to match the executable name and the location specified in thepom.xml, so change the last line of the configuration to"nativeImagePath": "${workspaceFolder}/target/javagdb". -
Add an argument to specify the number that you want to calculate the factorial, for example,
“args”: “100”. Your configuration should look like this:{ “type”: “nativeimage”, “request”: “launch”, “name”: “Launch Native Image”, “nativeImagePath”: “${workspaceFolder}/target/javagdb”, “args”: “100” }
Run and Debug the Demo
To run the application in debug mode, first set a breakpoint in the source code. Then go to the Run and Debug activity in the top navigation panel, select Launch Native Image and click the green arrow to run this configuration. VS Code will execute your native executable, attach to the application process, open the Java source file, letting you debug it. You step over the code, explore local variables, specify expressions to be evaluated, etc.
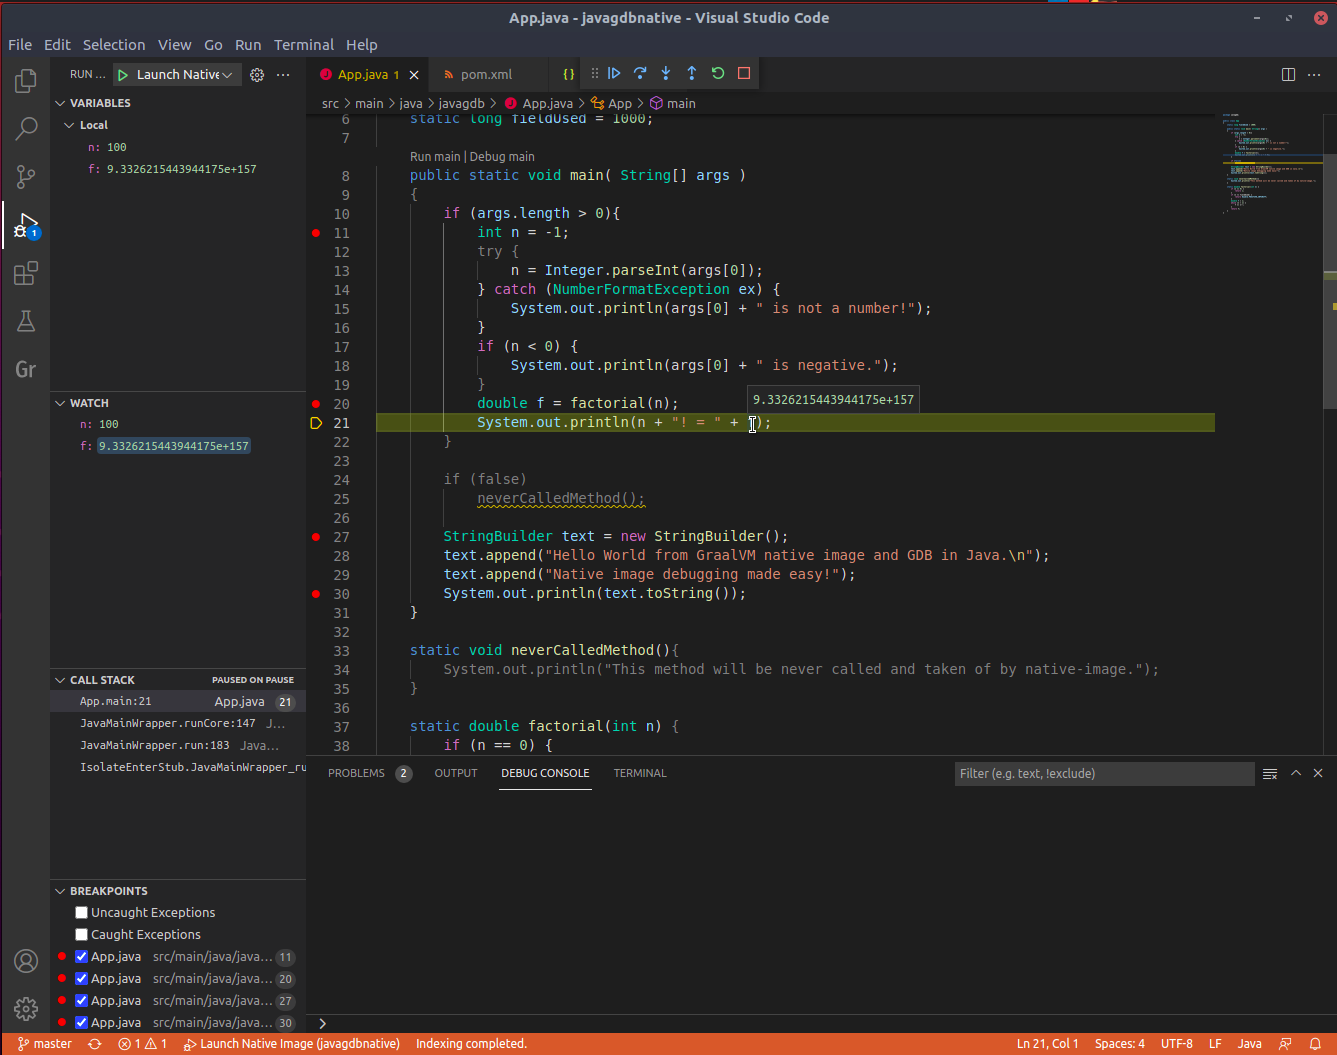
Notice that some code is greyed out in the source file. For example, the method neverCalledMethod():
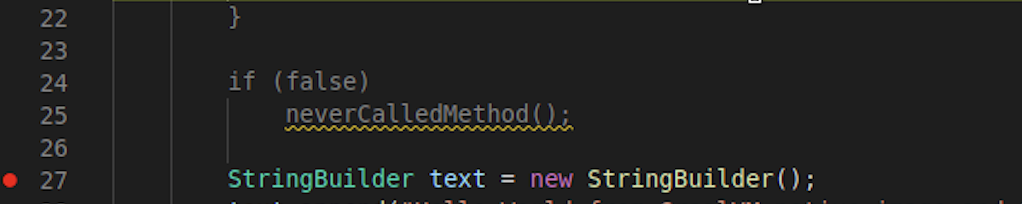
The native-image builder removes the code that is not used by the application at run time.
This could be some uncalled library or some unreachable methods.
The VS Code extension recognises these elimitations and will grey out both the body of eliminated method and the method call.
The shaded code is not a part of the native executable.
Learn More
Get hands-on lab experience debugging a native executable using the Oracle Linux environment in Oracle Cloud by running this interactive workshop: GraalVM Native Image Debugging.