◀Table of Contents
Tracing with Insight
It is possible to use the GraalVM Insight to implement smooth, declarative, ad hoc tracing via standard OpenTracing API.
The traces can be added into running application and customized on the fly to extract the right information needed to investigate any misbehavior incident.
The following examples will demonstrate the tracing capabilities with GraalVM Insight. To start, install the Jaeger’s client side instrumentation library for Node.js:
graalvm/bin/npm install jaeger-client@3.17.1
Now you can use the OpenTracing API provided by the jaeger-client module in your instrument agent.js via the tracer object (once it becomes available, it will discussed later in this guide):
let initialize = function(tracer) {
    var counter = 0;

    insight.on('enter', function(ctx, frame) {
        const args = frame.args;
        if ('request' !== frame.type || args.length !== 2 || typeof args[0] !== 'object' || typeof args[1] !== 'object') {
            return;
        }
        const req = args[0];
        const res = args[1];
        const span = tracer.startSpan("request");
        span.setTag("span.kind", "server");
        span.setTag("http.url", req.url);
        span.setTag("http.method", req.method);
        res.id = ++counter;
        res.span = span;
        console.log(`agent: handling #${res.id} request for ${req.url}`);
    }, {
        roots: true,
        rootNameFilter: 'emit',
        sourceFilter: src => src.name === 'events.js'
    });

    insight.on('return', function(ctx, frame) {
        var res = frame['this'];
        if (res.span) {
            res.span.finish();
            console.log(`agent: finished #${res.id} request`);
        } else {
            //Caused, for example, by Tracer itself connecting to the Jaeger server
        }
    }, {
        roots: true,
        rootNameFilter: 'end',
        sourceFilter: src => src.name === '_http_outgoing.js'
    });
    console.log('agent: ready');
};
The system hooks into emit('request', ...) and res.end() functions which are used to initialize a response to an HTTP request and finish it.
Because the res object is a dynamic JavaScript object, it is possible to add id and span attributes to it in the enter handler of the emit function from the source events.js.
Then it is possible to use these attributes in the return handler of the end function.
GraalVM Insight provides access to frame variables and their fields.
As such, the instrument can read value of req.url or req.method and provide them as span.setTag values to the OpenTracing server.
With this instrument, it is just a matter of being able to enable it at the right time. Check the Embedding Insight into Node.js Application section to see how to create an admin server and apply any trace scripts (including OpenTracing based ones) dynamically when needed. For purposes of this guide, something simpler will be used.
Enable the instrument when the jaeger object is provided to it:
let initializeJaeger = function (ctx, frame) {
    insight.off('enter', initializeJaeger);

    let jaeger = frame.jaeger;

    var initTracer = jaeger.initTracer;
    console.log('agent: Jaeger tracer obtained');

    // See schema https://github.com/jaegertracing/jaeger-client-node/blob/master/src/configuration.js#L37
    var config = {
      serviceName: 'insight-demo',
      reporter: {
        // Provide the traces endpoint. This forces the client to connect directly to the Collector and send
        // spans over HTTP
        collectorEndpoint: 'http://localhost:14268/api/traces',
        // Provide username and password if authentication is enabled in the Collector
        // username: '',
        // password: '',
      },
      sampler: {
          type : 'const',
          param : 1
      }
    };
    var options = {
      tags: {
        'insight-demo.version': '1.1.2',
      },
    //  metrics: metrics,
      logger: console,
      sampler: {
          type : 'const',
          param : 1
      }
    };

    var tracer = initTracer(config, options);
    initialize(tracer);
};

insight.on('return', initializeJaeger, {
  roots: true,
  rootNameFilter: 'jaegerAvailable'
});
This instrument needs help from the main server script.
Let the server.js obtain the jaeger-client module and pass it to the agent via the jaegerAvailable function.
Then it creates a typical HTTP server.
The content of server.js is:
function jaegerAvailable(jaeger) {
    console.log("Providing Jaeger object to the agent");
}
jaegerAvailable(require("jaeger-client"));

const http = require("http");
const srv = http.createServer((req, res) => {
    console.log(`server: obtained request ${res.id}`);
    setTimeout(() => {
        res.write(`OK# ${res.id}`);
        console.log(`server: replied to request ${res.id}`);
        res.end();
    }, 5);
});
srv.listen(8080);
With these two files you can launch the node application as well as the agent. But, first of all, start the Jaeger server:
docker run -d --name jaeger \
-e COLLECTOR_ZIPKIN_HTTP_PORT=9411 \
-p 5775:5775/udp   -p 6831:6831/udp   -p 6832:6832/udp \
-p 5778:5778   -p 16686:16686   -p 14268:14268   -p 9411:9411 \
jaegertracing/all-in-one:latest

graalvm/bin/node --insight=agent.js server.js
Providing Jaeger object to the agent
agent: Jaeger tracer obtained
Initializing Jaeger Tracer with RemoteReporter and ConstSampler(always)
agent: ready
Now you can connect to the Jaeger UI available at http://localhost:16686/ and put the server under some load:
ab -c 10 -n 10000 http://localhost:8080/
The server prints to the console detailed information while handling the requests and the Jaeger UI fills with the traces:
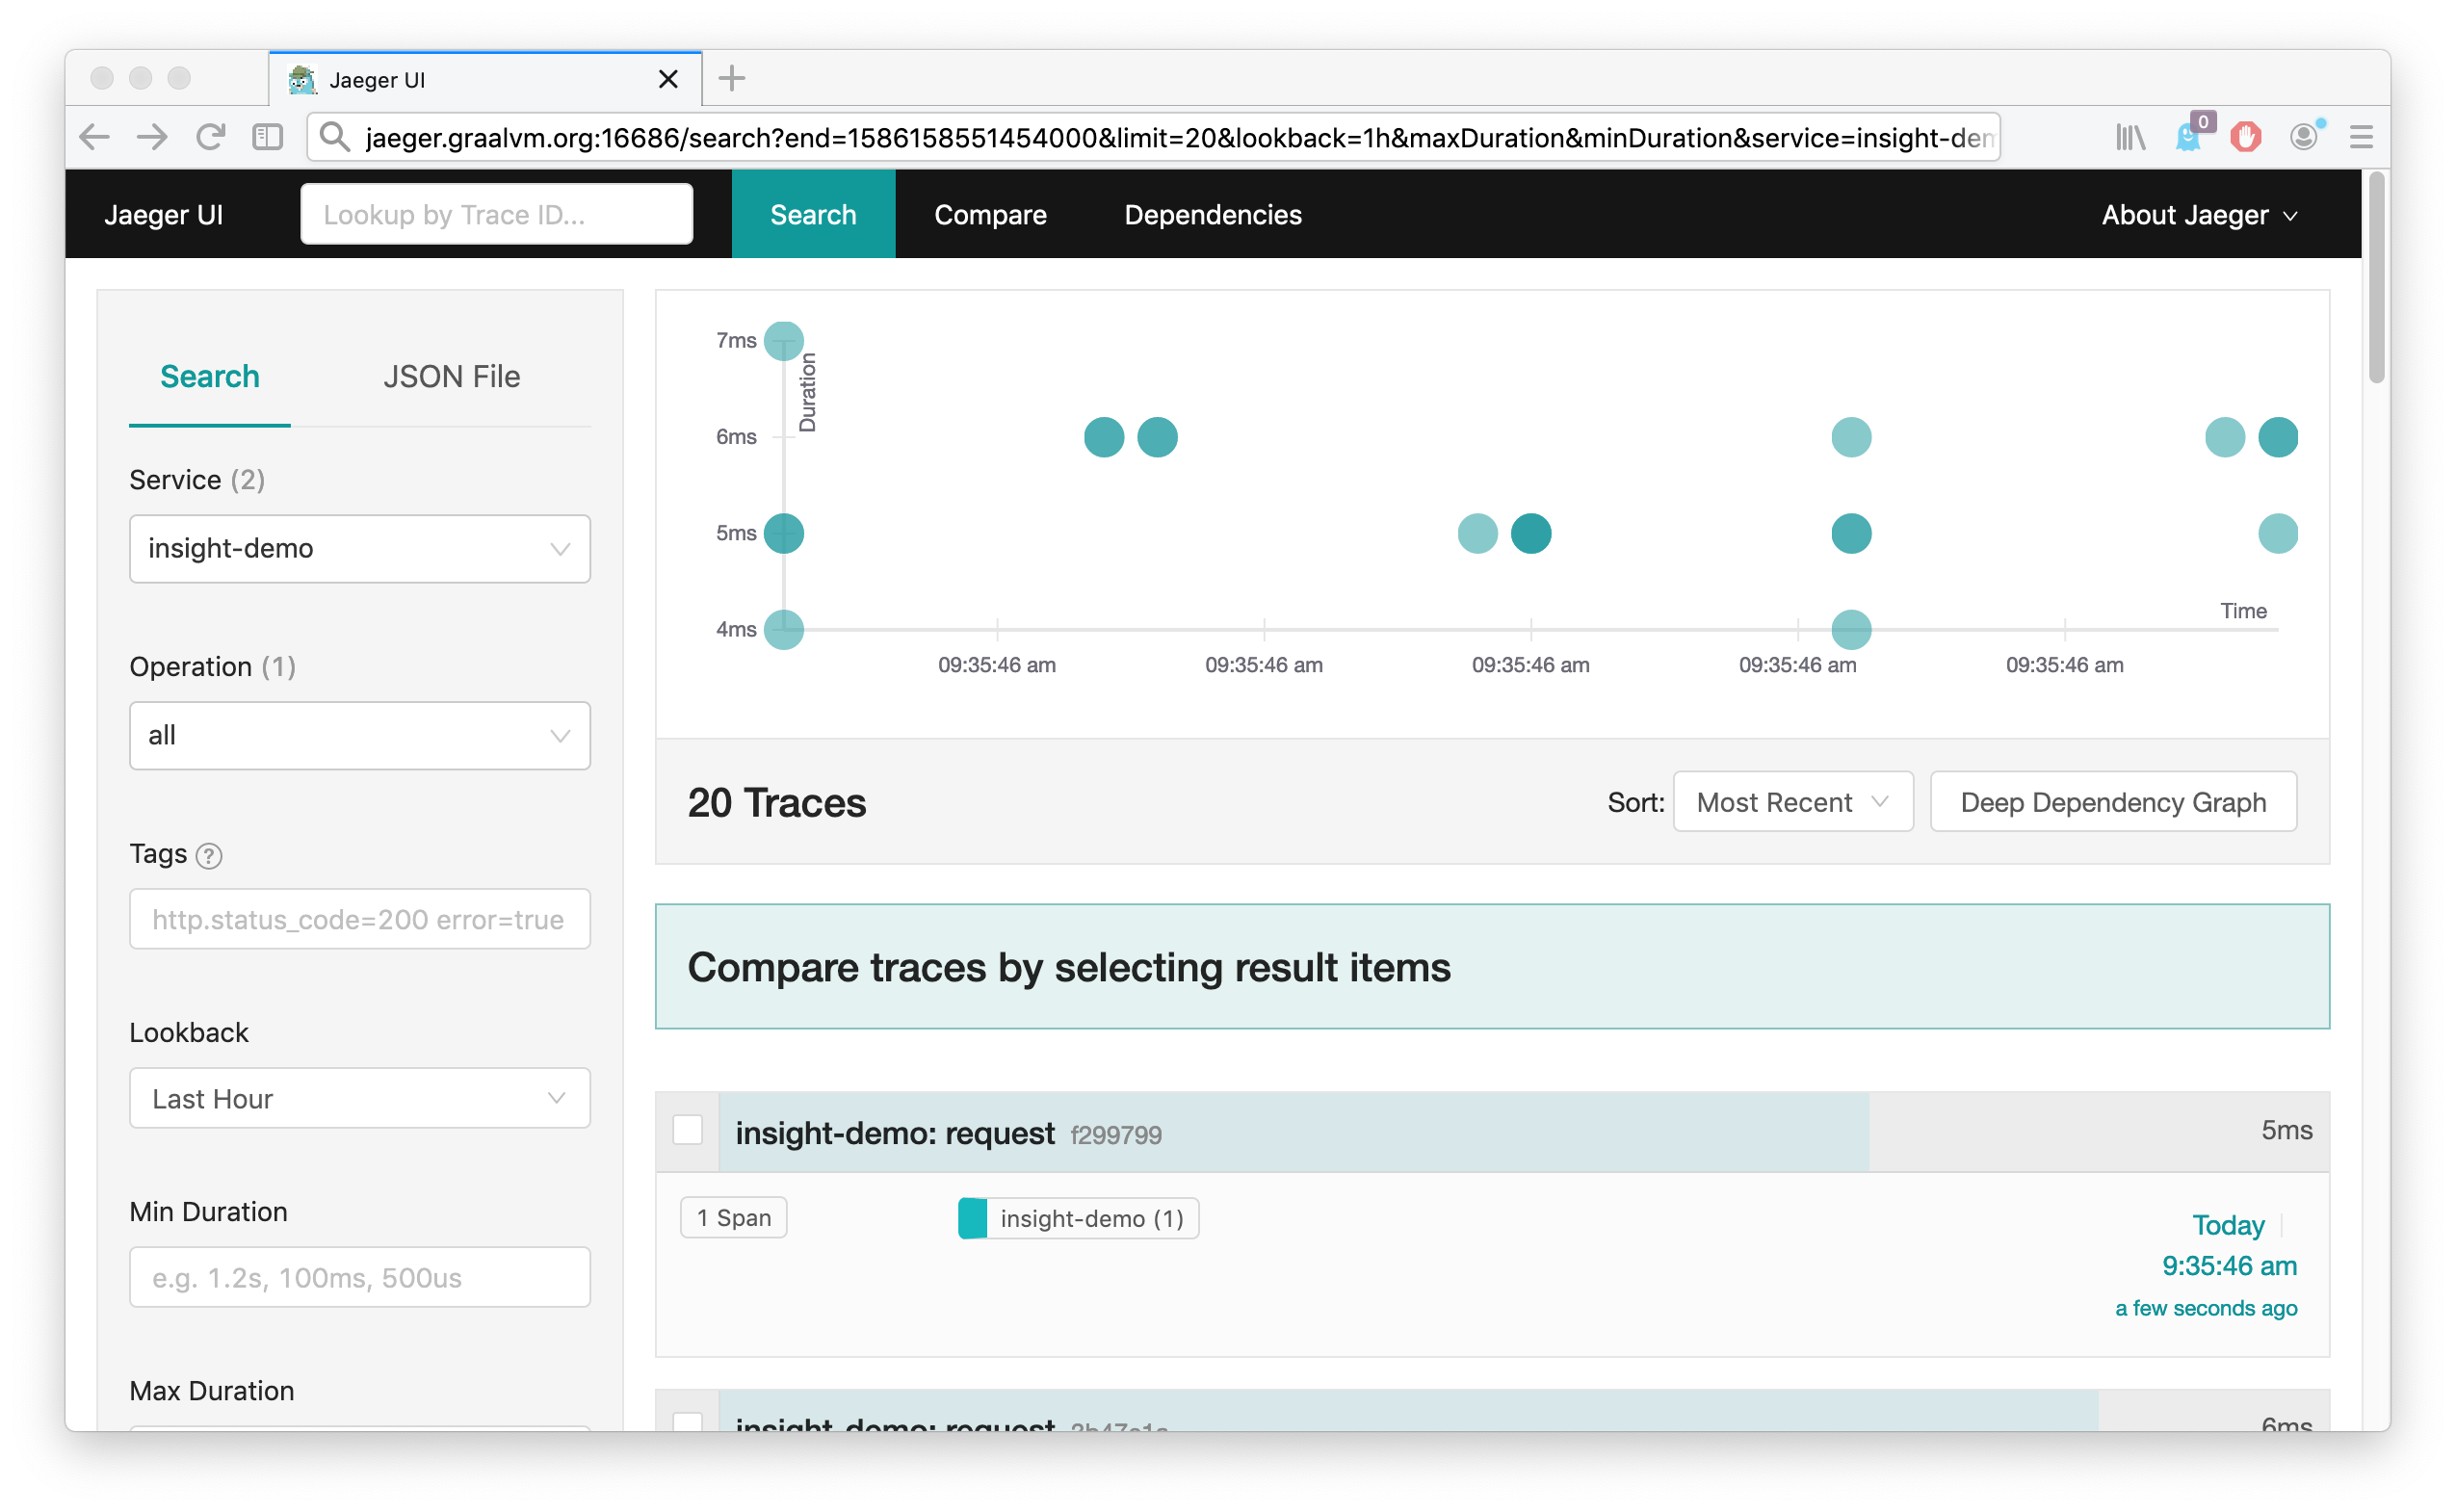
This completes the guide how to enhance a plain Node.js application with tracing.
The traces remain separated in its own agent.js file and can be applied at start time (demonstrated here) or dynamically when needed.
What to Read Rext
To learn more about Insight and find some challenging tasks, go to the Insight Manual.