◀Table of Contents
Ideal Graph Visualizer
Ideal Graph Visualizer (IGV) is a developer tool allowing users to analyze compilation graphs and investigate performance issues. The tool is essential for any language implementers building on top of Oracle GraalVM Enterprise Edition. It is available as a separate download on Oracle Technology Network and requires accepting the Oracle Technology Network Developer License.
IGV is developed to view and inspect intermediate representation graphs – a language-independent intermediate representation (IR) between the source language and the machine code, generated by the compiler. See Dumping Graphs below.
- Unzip the downloaded package and enter
bindirectory:cd idealgraphvisualizer/bin - Launch the tool:
idealgraphvisualizer - Save the following code snippet as
Test.rb:require 'json' obj = { time: Time.now, msg: 'Hello World', payload: (1..10).to_a } encoded = JSON.dump(obj) js_obj = Polyglot.eval('js', 'JSON.parse').call(encoded) puts js_obj[:time] puts js_obj[:msg] puts js_obj[:payload].join(' ') - From another console window, make sure the
rubyruntime is available in GraalVM Enterprise, and connect theTest.rbscript to the running IGV:gu list ruby --jvm --polyglot --vm.Dgraal.Dump=:1 --vm.Dgraal.PrintGraph=Network Test.rbThis causes GraalVM Enterprise to dump compiler graphs in the IGV format over the network to an IGV process listening on
127.0.0.1:4445. Once the connection is made, you are able to see the graphs in the Outline window. Find, e.g., thejava.lang.String.char(int)folder and open its After Parsing graph by double-clicking. If the node hassourceNodePositionproperty, then the Processing window will attempt to display its location and the entire stacktrace.
Browsing Graphs
Once a specific graph is opened, you can search for nodes by name, ID, or by property=value data, and all matching results will be shown.
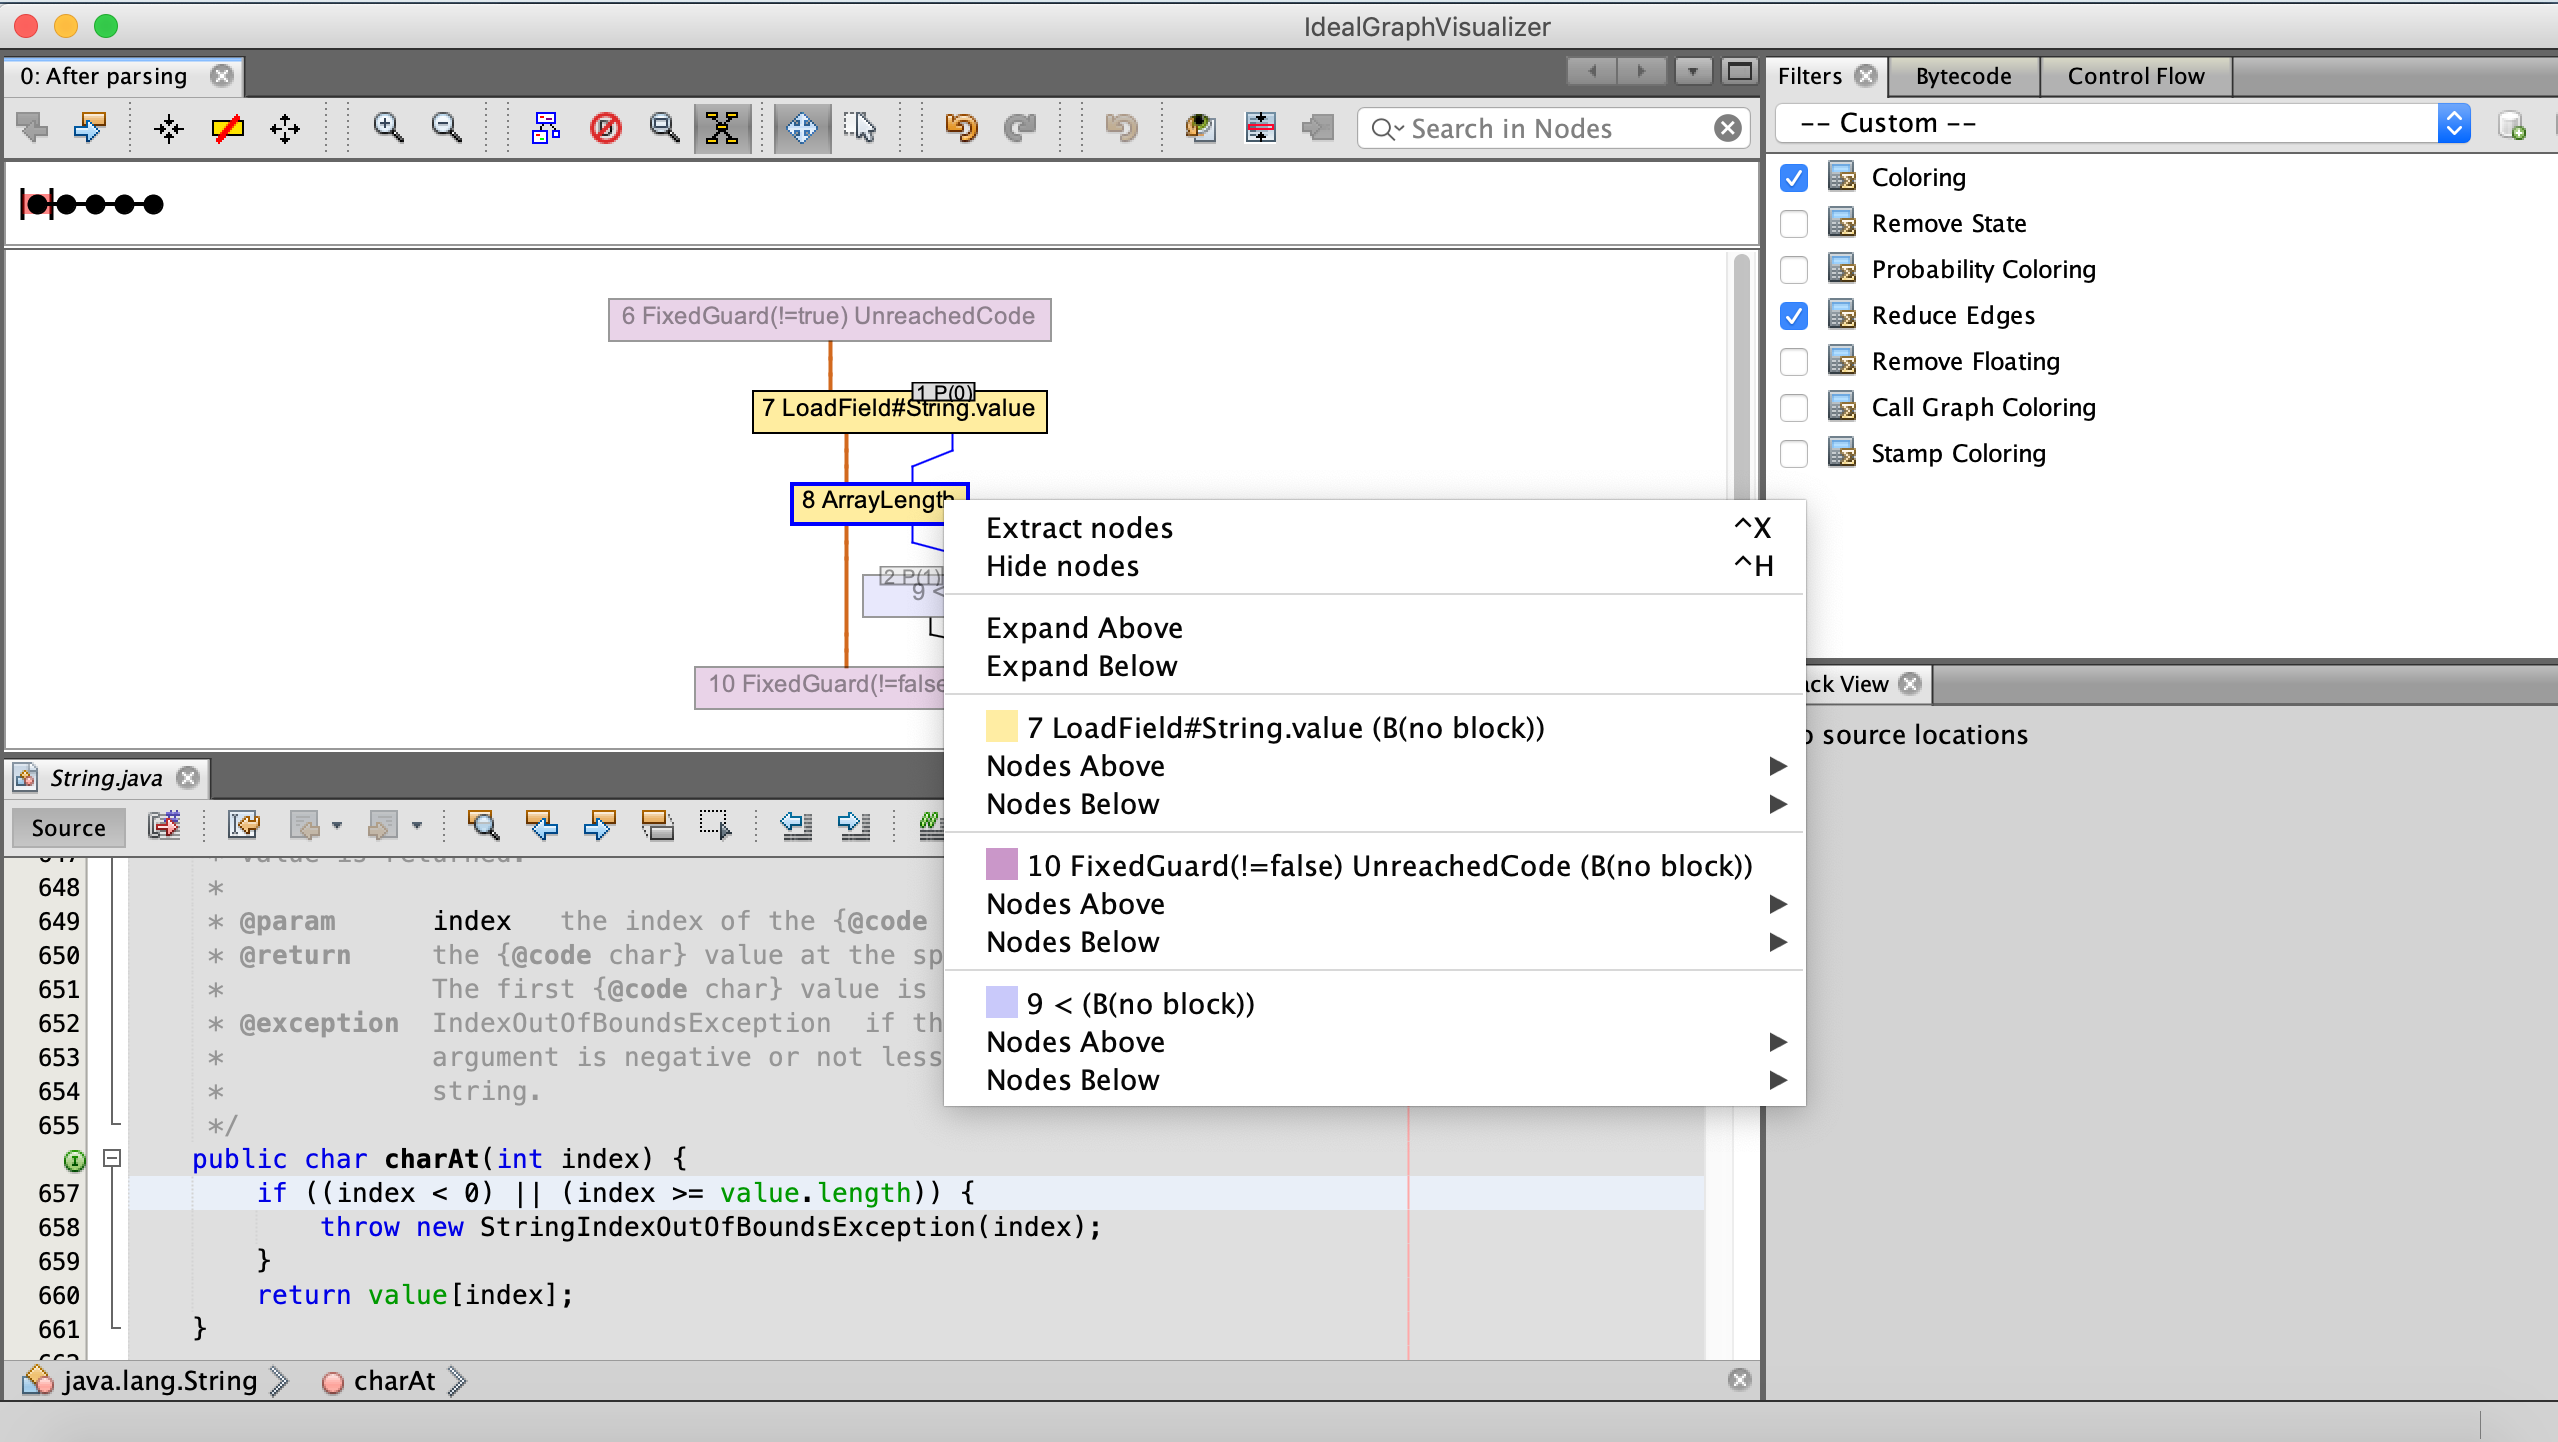
Another great feature of this tool is the ability to navigate to the original guest language source code.
Select a node in the graph and press the Go to Source button in the Stack View window.
Graphs navigation is also available from the Context menu, enabled by focusing and right-clicking a specific graph node. The Extract Nodes option will re-render a graph and display only the selected nodes and their neighbors.
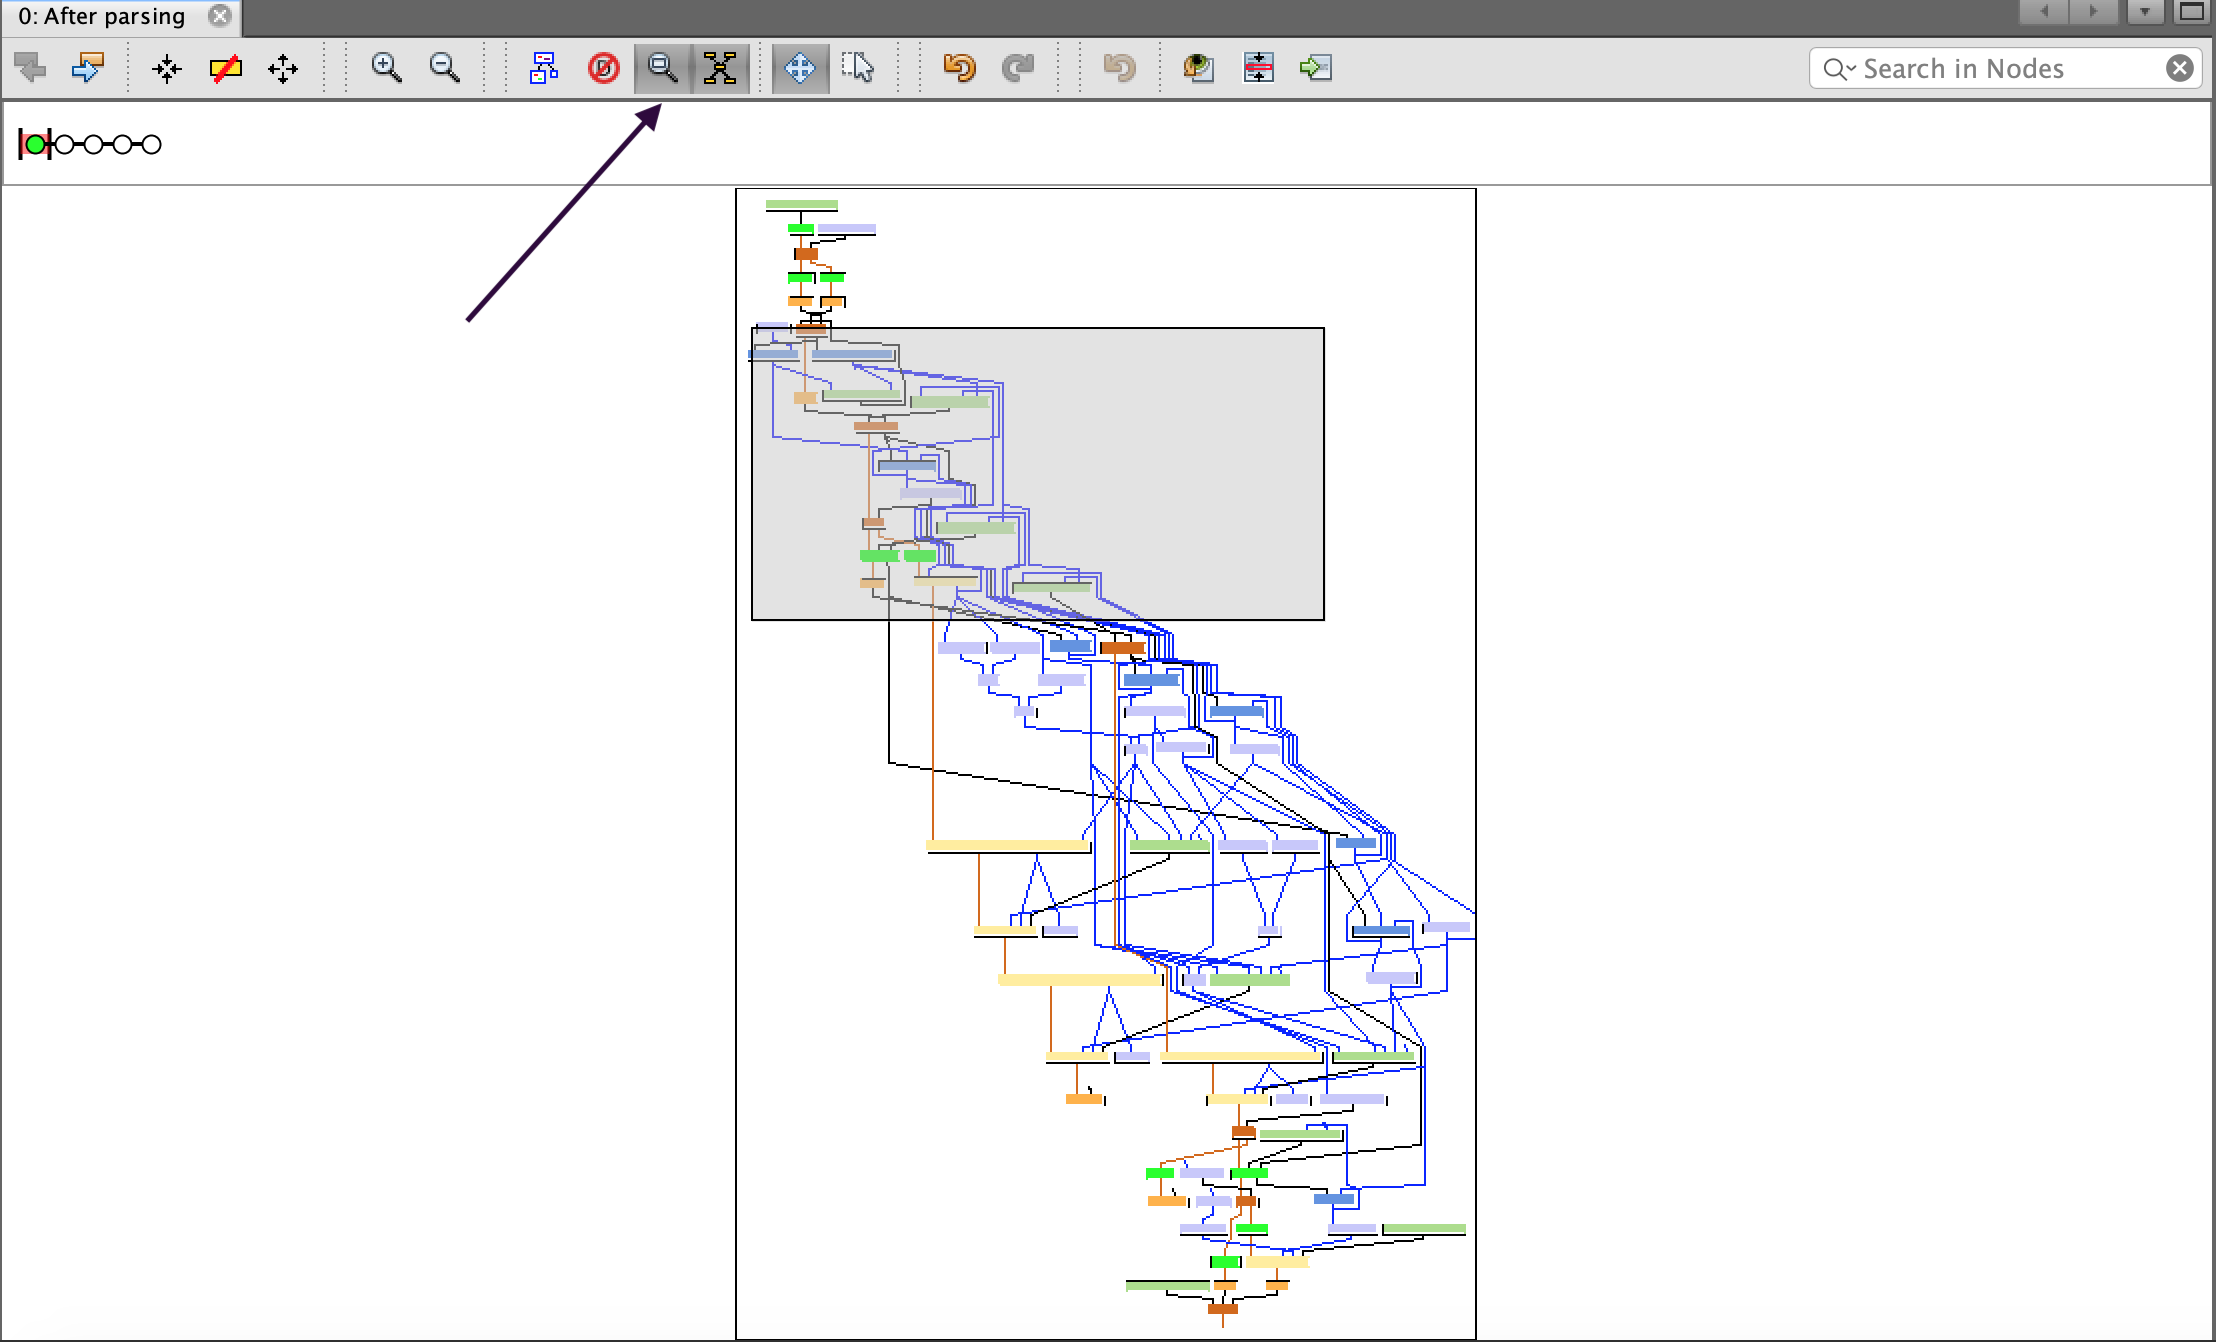
If the graph is larger than the screen, manipulate with the Satellite view button in the main toolbar to move the viewport rectangle.
For user preference, the graph color scheme is adjustable by editing the Coloring filter, enabled by default in the left sidebar.
Viewing Source Code
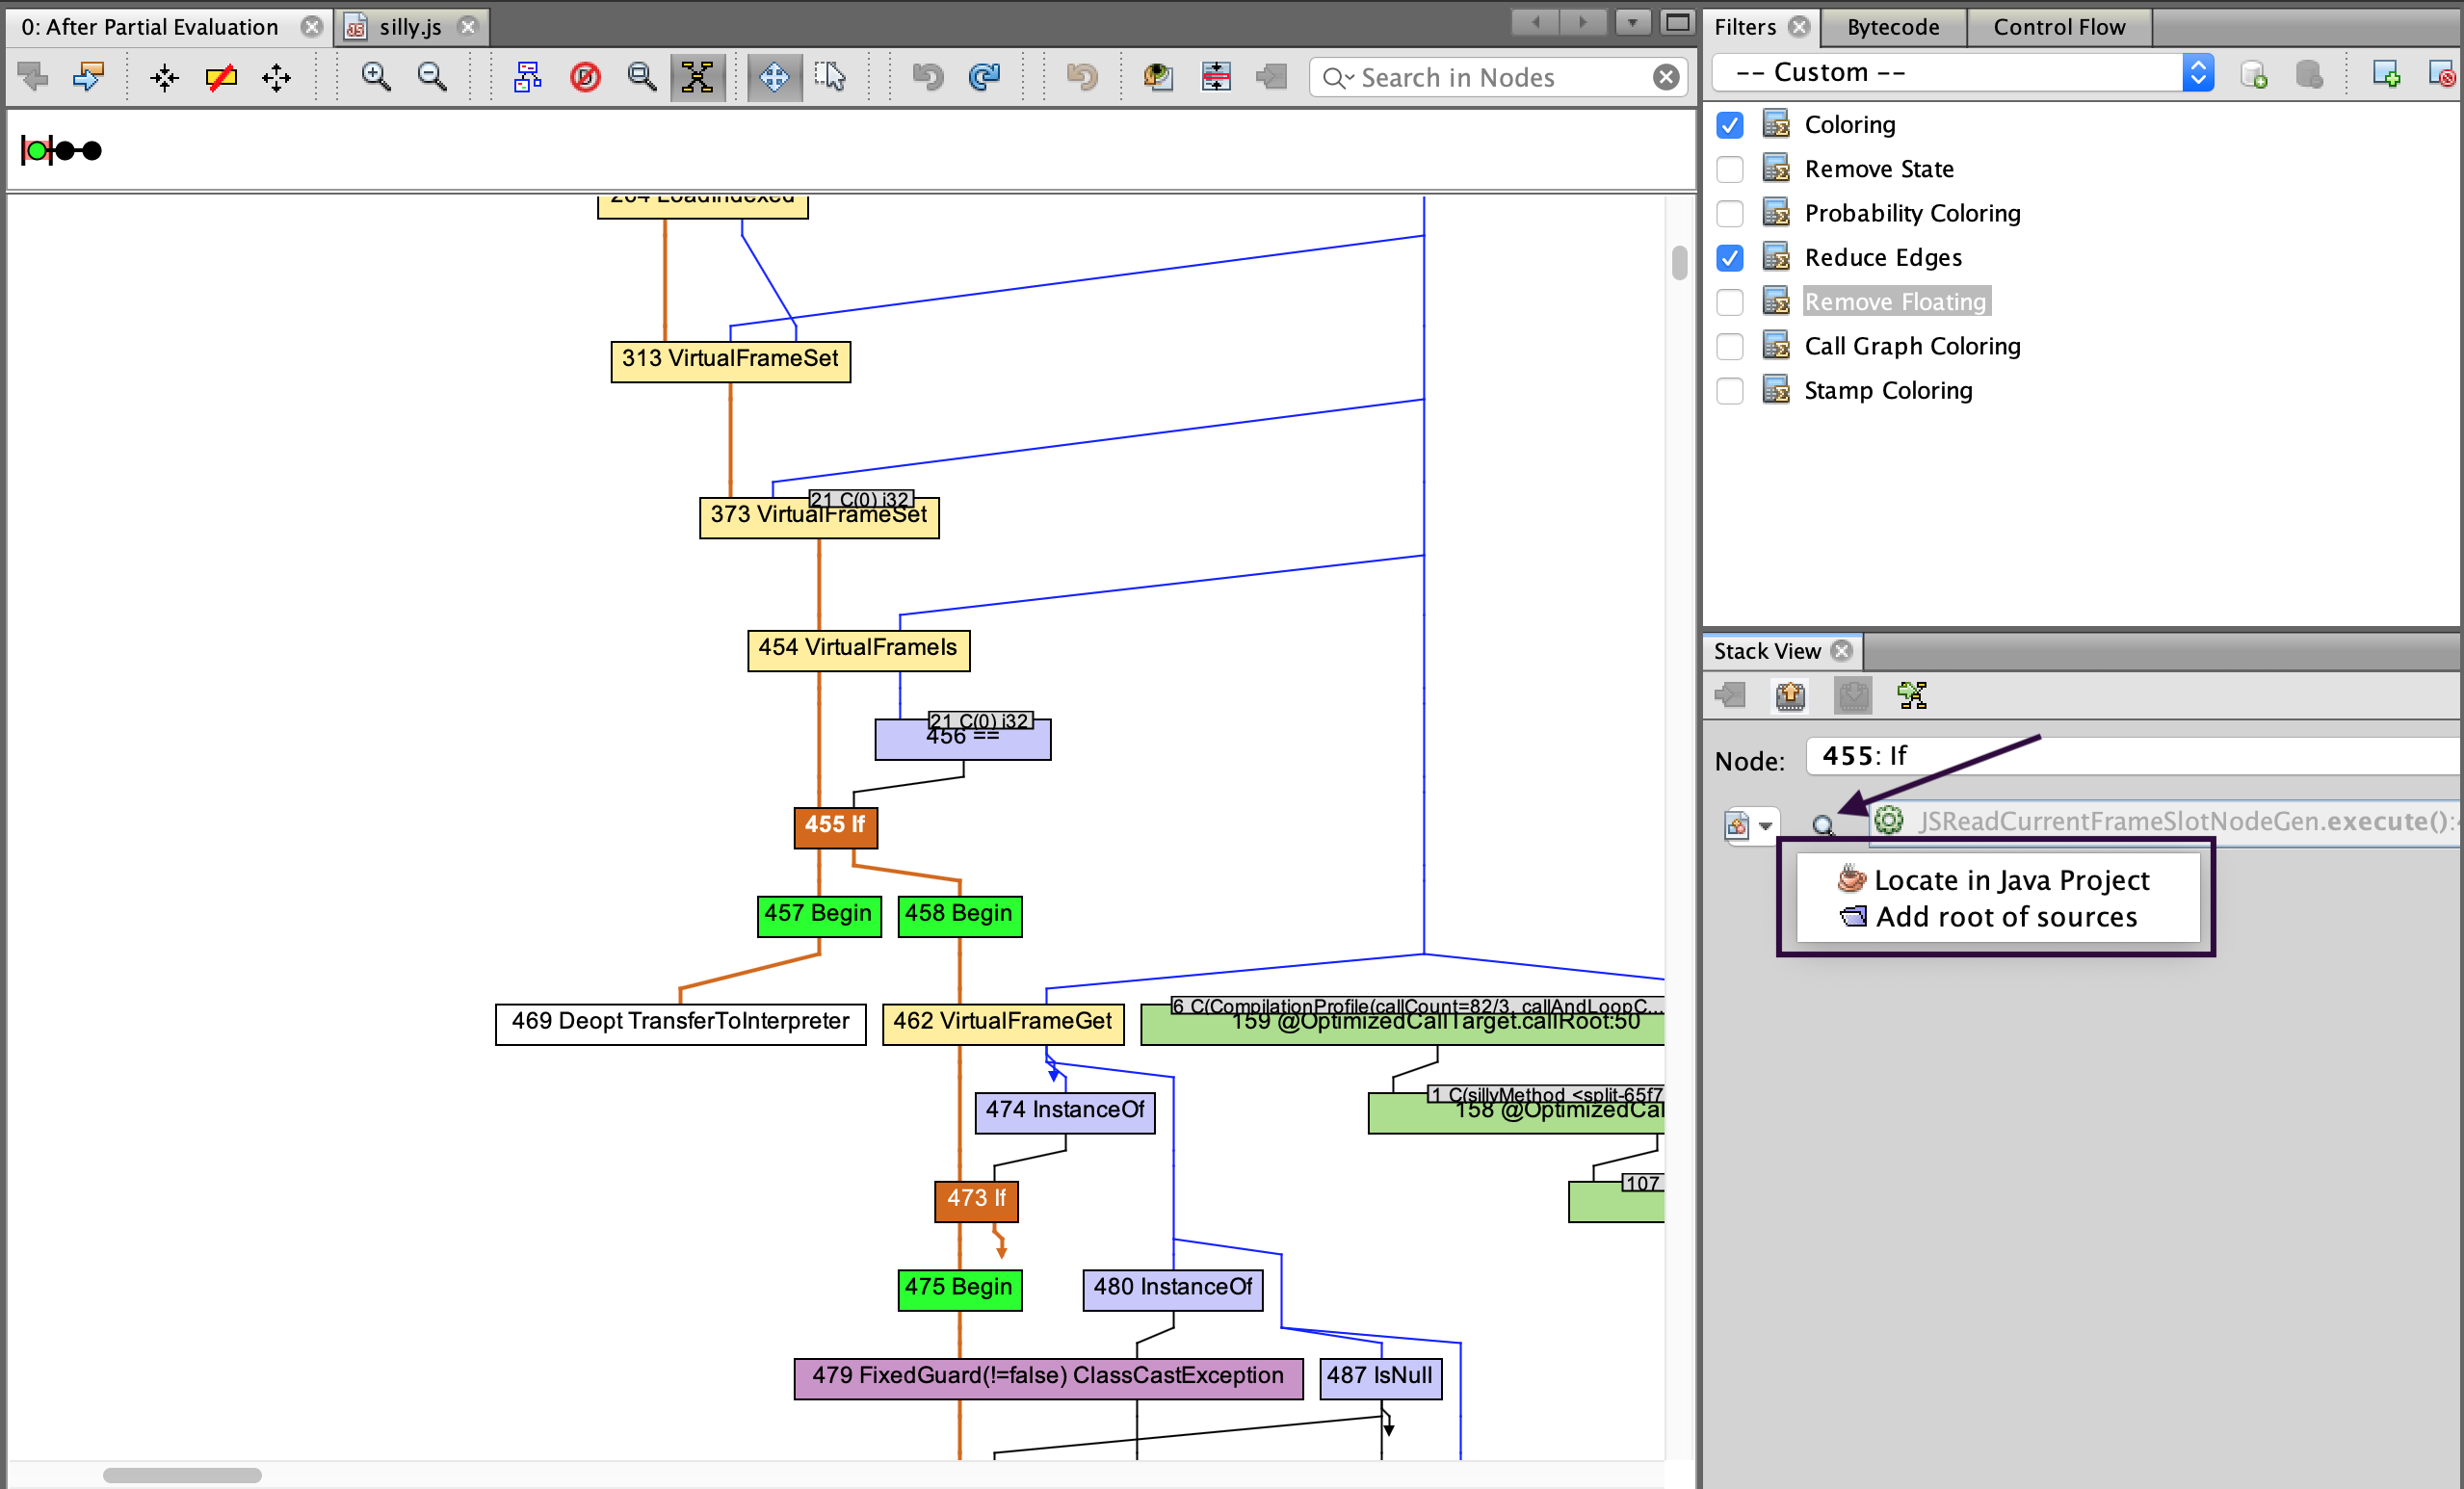
Source code views can be opened in manual and assisted modes. Once you select a node in the graph view, the Processing view will open. If the IGV knows where the source code for the current frame is, the green Go to Source arrow is enabled. If the IGV does not know where the source is, the line is greyed out and a Looking Glass button appears.
Press it and select Locate in Java project to locate the correct project in the dialog. The IGV hides projects which do not contain the required source file. The Source Collections serves to display the stand alone roots added by “Add root of sources” general action. If the source is located using the preferred method (i.e., from a Java project), its project can be later managed on the Project tab. That one is initially hidden, but you can display the list of opened projects using Window -> Projects.
Dumping Graphs
The IGV tool is developed to allow GraalVM Enterprise language implementers to optimize their languages assembled with the Language Implentation Framework. As a development tool it should not be installed to production environments.
To dump the GraalVM compiler graphs from an embedded Java application to the IGV, you need to add options to GraalVM-based processes.
Depending on the language/VM used, you may need to prefix the options by --vm.
See the particular language’s documentation for the details.
The main option to add is -Dgraal.Dump=:1.
This will dump graphs in an IGV readable format to the local file system.
To send the dumps directly to the IGV over the network, add -Dgraal.PrintGraph=Network when starting a GraalVM instance.
Optionally a port can be specified.
Then dumps are sent to the IGV from the running GraalVM on localhost.
If the IGV does not listen on localhost, Options -> Ideal Graph Settings|Accept Data From Network can be checked.
If there is not an IGV instance listening on 127.0.0.1 or it cannot be connected to, the dumps will be redirected to the local file system.
The file system location is graal_dumps/ under the current working directory of the process and can be changed with the -Dgraal.DumpPath option.
In case an older GraalVM Enterprise is used, you may need to explicitly request that dumps include the nodeSourcePosition property.
This is done by adding the -XX:+UnlockDiagnosticVMOptions -XX:+DebugNonSafepoints options.