◀Table of Contents
Profiling Command Line Tools
GraalVM profiling command line tools help you optimize your code through analysis of CPU and memory usage.
Most applications spend 80% of their runtime in 20% of the code. For this reason, to optimize the code, it is essential to know where the application spends its time. In this section, we use an example application to demonstrate the three main profiling capabilities that GraalVM offers: CPU Tracer, CPU Sampler, and Memory Tracer.
This example application uses a basic prime number calculator based on the Sieve of Eratosthenes algorithm.
-
Copy the following code into a new file named
primes.js:class AcceptFilter { accept(n) { return true } } class DivisibleByFilter { constructor(number, next) { this.number = number; this.next = next; } accept(n) { var filter = this; while (filter != null) { if (n % filter.number === 0) { return false; } filter = filter.next; } return true; } } class Primes { constructor() { this.number = 2; this.filter = new AcceptFilter(); } next() { while (!this.filter.accept(this.number)) { this.number++; } this.filter = new DivisibleByFilter(this.number, this.filter); return this.number; } } var primes = new Primes(); var primesArray = []; for (let i = 0; i < 5000; i++) { primesArray.push(primes.next()); } console.log(`Computed ${primesArray.length} prime numbers. ` + `The last 5 are ${primesArray.slice(-5)}.`); - Run
js primes.js. The example application should print output as follows:js primes.js Computed 5000 prime numbers. The last 5 are 48563,48571,48589,48593,48611.This program takes a moment to compute. Next you will check where the time is spent.
- Run
js primes.js --cpusamplerto enable CPU sampling. CPU Sampler should print output for the example application as follows:js primes.js --cpusampler Computed 5000 prime numbers. The last 5 are 48563,48571,48589,48593,48611. ---------------------------------------------------------------------------------------------- Sampling Histogram. Recorded 250 samples with period 10ms. Self Time: Time spent on the top of the stack. Total Time: Time spent somewhere on the stack. ---------------------------------------------------------------------------------------------- Thread[main,5,main] Name || Total Time || Self Time || Location ---------------------------------------------------------------------------------------------- accept || 2150ms 86.0% || 2150ms 86.0% || primes.js~13-22:191-419 next || 2470ms 98.8% || 320ms 12.8% || primes.js~31-37:537-737 :program || 2500ms 100.0% || 30ms 1.2% || primes.js~1-46:0-982 ----------------------------------------------------------------------------------------------By default the sampler prints an execution time histogram for each JavaScript function.
You can produce a flame graph in SVG format by requesting that with the
--cpusampler=flamegraphoption:js primes.js --cpusampler=flamegraphIt should produce a file called
flamegraph.svgcontaining something like this: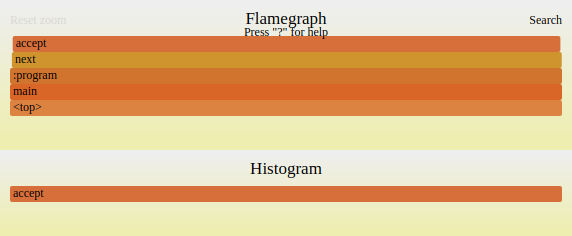
You can zoom into the graph by clicking on elements.
By default, CPU sampling takes a sample every 10 milliseconds. From the result, we can see that roughly 89% of the time is spent in the
DivisibleByFilter.acceptfunction.accept(n) { var filter = this; while (filter != null) { if (n % filter.number === 0) { return false; } filter = filter.next; } return true; }Now use the CPU Tracer to collect execution counts of each statement:
- Run
js primes.js --cputracer --cputracer.TraceStatements --cputracer.FilterRootName=*acceptto collect execution counts for all statements in methods ending withaccept:js primes.js --cputracer --cputracer.TraceStatements --cputracer.FilterRootName=accept Computed 5000 prime numbers. The last 5 are 48563,48571,48589,48593,48611. ----------------------------------------------------------------------------------------- Tracing Histogram. Counted a total of 468336895 element executions. Total Count: Number of times the element was executed and percentage of total executions. Interpreted Count: Number of times the element was interpreted and percentage of total executions of this element. Compiled Count: Number of times the compiled element was executed and percentage of total executions of this element. ----------------------------------------------------------------------------------------- Name | Total Count | Interpreted Count | Compiled Count | Location ----------------------------------------------------------------------------------------- accept | 234117338 50.0% | 365660 0.2% | 233751678 99.8% | primes.js~15:245-258 accept | 117053670 25.0% | 182582 0.2% | 116871088 99.8% | primes.js~16-18:275-348 accept | 117005061 25.0% | 181001 0.2% | 116824060 99.8% | primes.js~19:362-381 accept | 53608 0.0% | 1829 3.4% | 51779 96.6% | primes.js~14:211-227 accept | 53608 0.0% | 1829 3.4% | 51779 96.6% | primes.js~13-22:191-419 accept | 48609 0.0% | 1581 3.3% | 47028 96.7% | primes.js~17:322-334 accept | 4999 0.0% | 248 5.0% | 4751 95.0% | primes.js~21:402-413 accept | 1 0.0% | 1 100.0% | 0 0.0% | primes.js~2-4:25-61 accept | 1 0.0% | 1 100.0% | 0 0.0% | primes.js~3:45-55 -----------------------------------------------------------------------------------------The output shows execution counters for each statement, instead of timing information. Tracing histograms often provides insights into the behavior of the algorithm that needs optimization.
- Run
js primes.js --experimental-options --memtracerto display source code locations and counts of reported allocations. Note that the Memory Tracer tool for capturing allocations is currently an experimental feature in GraalVM. As such,--memtracermust be preceded by the--experimental-optionscommand line option.js primes.js --experimental-options --memtracer Computed 5000 prime numbers. The last 5 are 48563,48571,48589,48593,48611. ------------------------------------------------------------ Location Histogram with Allocation Counts. Recorded a total of 5007 allocations. Total Count: Number of allocations during the execution of this element. Self Count: Number of allocations in this element alone (excluding sub calls). -------------------------------------------------------- Name | Self Count | Total Count | Location -------------------------------------------------------- next | 5000 99.9% | 5000 99.9% | primes.js~31-37:537-737 :program | 6 0.1% | 5007 100.0% | primes.js~1-46:0-982 Primes | 1 0.0% | 1 0.0% | primes.js~25-38:424-739 --------------------------------------------------------This output shows the number of allocations which were recorded per function. For each prime number that was computed, the program allocates one object in
nextand one inconstructorofDivisibleByFilter. Allocations are recorded independently of whether they could get eliminated by the compiler.The GraalVM compiler is particularly powerful in optimizing allocations and can push allocations into infrequent branches to increase execution performance. The GraalVM team plans to add information about memory optimizations to the memory tracer in the future.
Tools Options
Use the --help:tools option in all guest language launchers to display reference information for CPU Sampler, CPU Tracer, and Memory Tracer.
The current set of available options is as follows.
CPU Sampler Options
--cpusampler: enables CPU Sampler. Disabled by default.--cpusampler.Delay=<Long>: delays the sampling for the given number of milliseconds (default: 0).--cpusampler.FilterFile=<Expression>: applies a wildcard filter for source file paths, for example,*program*.sl. The default is ∗.--cpusampler.FilterLanguage=<String>: profiles languages only with the matching mime-type, for example,+. The default is no filter.--cpusampler.FilterMimeType=<String>: profiles languages with mime-type. There is no filter by default.--cpusampler.FilterRootName=<Expression>: applies a wildcard filter for program roots, for example,Math.*. The default is ∗.--cpusampler.GatherHitTimes: saves a timestamp for each taken sample. The default is false.--cpusampler.MinSamples=<Integer>: removes elements from output if they have less samples than this value (default is0).--cpusampler.Output=<Output>: prints ahistogram,calltree,json, orflamegraphas output. The default ishistogram.--cpusampler.OutputFile=<String>: saves output to the given file. Output is printed to output stream by default.--cpusampler.Period=<Long>: specifies the period, in milliseconds, to sample the stack.--cpusampler.StackLimit=<Integer>: specifies the maximum number of stack elements.--cpusampler.SummariseThreads: prints sampling output as a summary of allper threadprofiles. The default is false.
CPU Tracer Options
--cputracer: enables the CPU tracer. Disabled by default.--cputracer.FilterFile=<Expression>: applies a wildcard filter for source file paths, for example,*program*.sl. The default is ∗.--cputracer.FilterLanguage=<String>: profiles languages only with the matching mime-type, for example,+. The default is no filter.--cputracer.FilterMimeType=<String>: profiles languages with mime-type. There is no filter by default.--cputracer.FilterRootName=<Expression>: applies a wildcard filter for program roots, for example,Math.*. The default is ∗.--cputracer.Output=<Output>prints ahistogramorjsonas output. The default ishistogram.--cpusampler.OutputFile=<String>: saves output to the given file. Output is printed to output stream by default.--cputracer.TraceCalls: captures calls when tracing. The default is false.--cputracer.TraceRoots=<Boolean>: captures roots when tracing. The default is true.--cputracer.TraceStatements: captures statements when tracing. The default is false.
Memory Tracer Options
The memory tracer tool is currently an experimental tool. Make sure to prepend the --experimental-options flag to enable --memtracer.
--memtracer: enables the memory tracer. Disabled by default.--memtracer.FilterFile=<Expression>: applies a wildcard filter for source file paths, for example,*program*.sl. The default is ∗.--memtracer.FilterLanguage=<String>: profiles languages only with the matching mime-type, for example,+. The default is no filter.--memtracer.FilterMimeType=<String>: profiles languages with mime-type. There is no filter by default.--memtracer.FilterRootName=<Expression>: applies a wildcard filter for program roots, for example,Math.*. The default is ∗.--memtracer.Output=<Format>: prints atypehistogram,histogram, orcalltreeas output. The default ishistogram.--memtracer.StackLimit=<Integer>: sets the maximum number of maximum stack elements.--memtracer.TraceCalls: captures calls when tracing. The default is false.--memtracer.TraceRoots=<Boolean>: captures roots when tracing. The default is true.--memtracer.TraceStatements: captures statements when tracing. The default is false.