◀Table of Contents
Here you will find information about how to:
- Run Java Applications on GraalVM from the CLI
- Run Java Applications on GraalVM from an IDE
- Debug Java Applications on GraalVM from an IDE
- Configure JVM Options for Applications Running on GraalVM
- Profile Java Applications on GraalVM with VisualVM
Run Java Applications on GraalVM from the CLI
Any application that runs on a Java Virtual Machine (JVM) can run on GraalVM. GraalVM includes a JDK based on the Java HotSpot VM, and integrates an optimizing, just-in-time (JIT) compiler, written in Java: the GraalVM compiler. At runtime, an application is loaded and executed normally by the JVM.
In order to follow the steps in this guide, you must have GraalVM installed. In case you do not have it installed, getting GraalVM downloaded and ready-to-go should only take a few minutes. Choose your operating system and proceed to the installation steps:
For the purpose of this guide, GraalVM Enterprise based on Java 11 distribution for macOS platform is used.
To ensure you have successfully installed GraalVM, verify it is available in the PATH environment variable and the JAVA_HOME points to it.
echo $PATH
/Library/Java/JavaVirtualMachines/graalvm-ee-java11-<version>/Contents/Home/bin:...
echo $JAVA_HOME
/Library/Java/JavaVirtualMachines/graalvm-ee-java11-<version>/Contents/Home
This guide uses Spring PetClinic as the sample application. This web application demonstrates the use of Spring Boot with Spring MVC and Spring Data JPA.
Next, clone the project and navigate to the project’s directory:
git clone https://github.com/spring-projects/spring-petclinic.git
cd spring-petclinic
The Spring PetClinic application is built with Maven so you can build a JAR file and then run it from the command line.
The basic syntax to launch a Java application from a JAR file with GraalVM is: java -jar <JAR file>.
Now you can build the application and run it as with any other JDK.
./mvnw package
java -jar target/spring-petclinic-2.3.0.BUILD-SNAPSHOT.jar
Also, you can run this sample application from Maven directly using the Spring Boot Maven plugin:
./mvnw spring-boot:run
When the application starts, access it on localhost:8000.
If your Java project is built with Gradle, run ./gradlew build to build the project and then run it from a JAR file as usual (java -jar <JAR file>).
Run Java Applications on GraalVM from an IDE
If you find it more comfortable to work with projects from an IDE, for example, Eclipse IDE, Intellij IDEA, NetBeans IDE, and so on, you can also specify GraalVM as a default JDK in the IDE and run applications using GraalVM from then.
To run a Java project on GraalVM from an IDE requires setting GraalVM as a project’s default JDK. For example, to run the Spring PetClinic project using Intellij IDEA, you need to:
1. Open the project (File -> Open) and browse Spring PetClinic sources from a local drive.
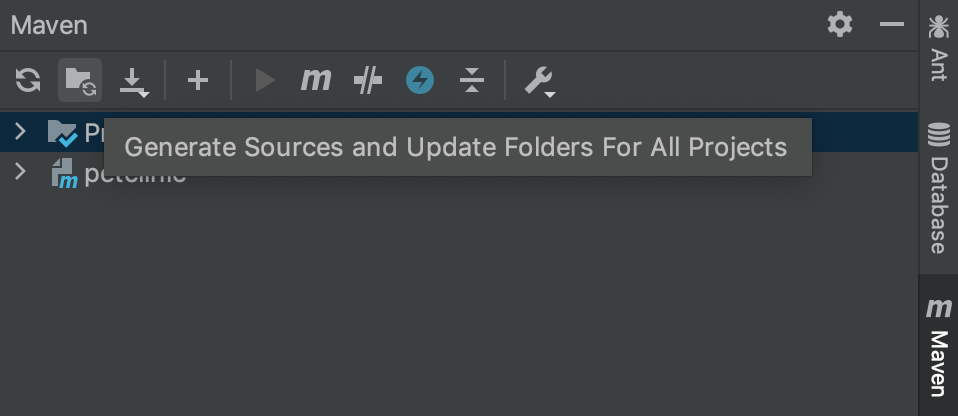
2. Generate sources and update folders for the project. Intellij IDEA does not include generated sources automatically, so you need to generate them. In the Maven sidebar, click on the folder with the spinner icon:
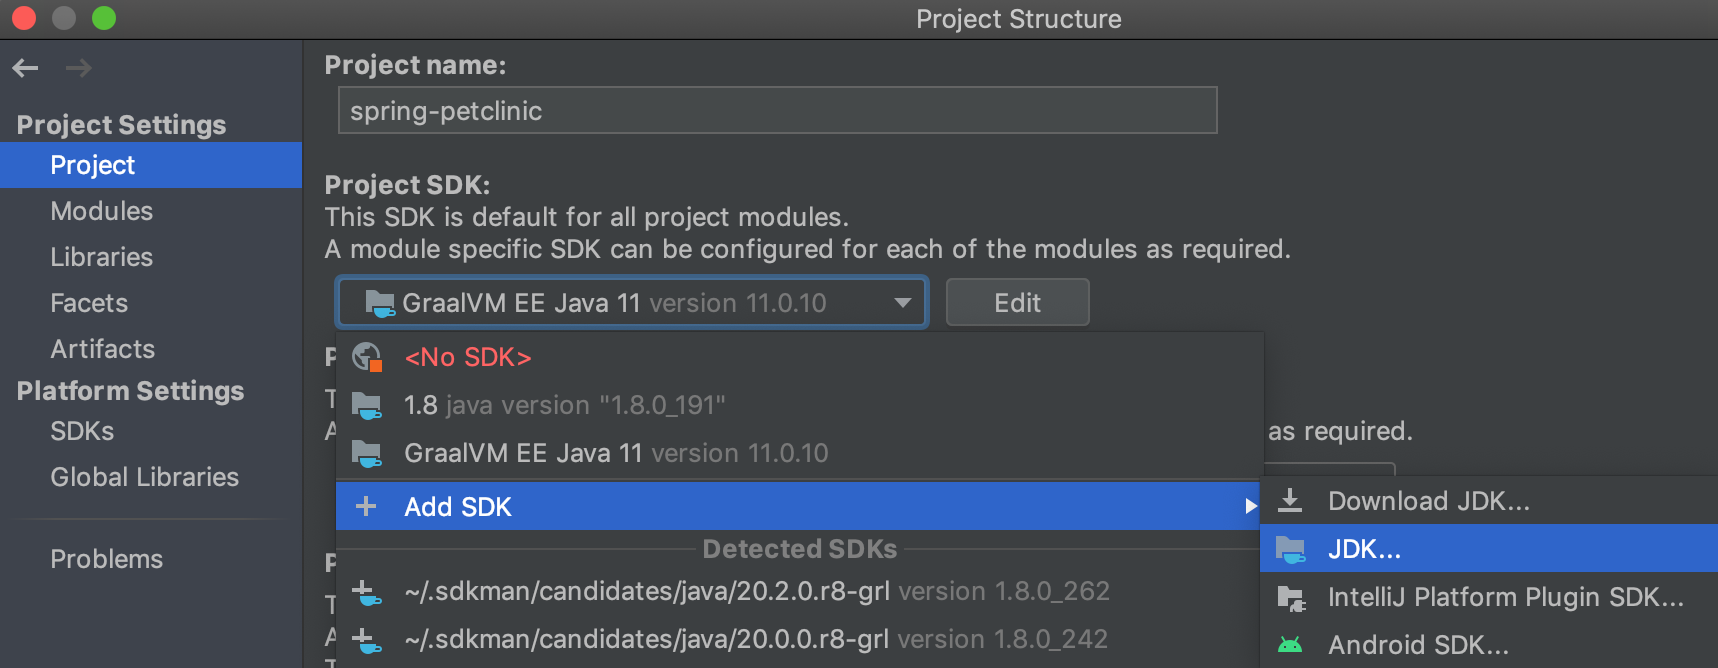
3. Add GraalVM as the project’s SDK. Navigate to File -> Project Structure -> Project -> Project SDK. Expand the drop down, press Add SDK -> JDK and open the folder where you installed GraalVM. For macOS users, JDK home path will be /Library/Java/JavaVirtualMachines/{graalvm}/Contents/Home. Give it a name, and press Apply.
If you wish to add GraalVM SDK platform-wise, navigate to Project Structure -> Platform Settings -> SDK. Then press the plus button (+) -> Add JDK and open the folder where you installed GraalVM. Give it a name and press Apply.
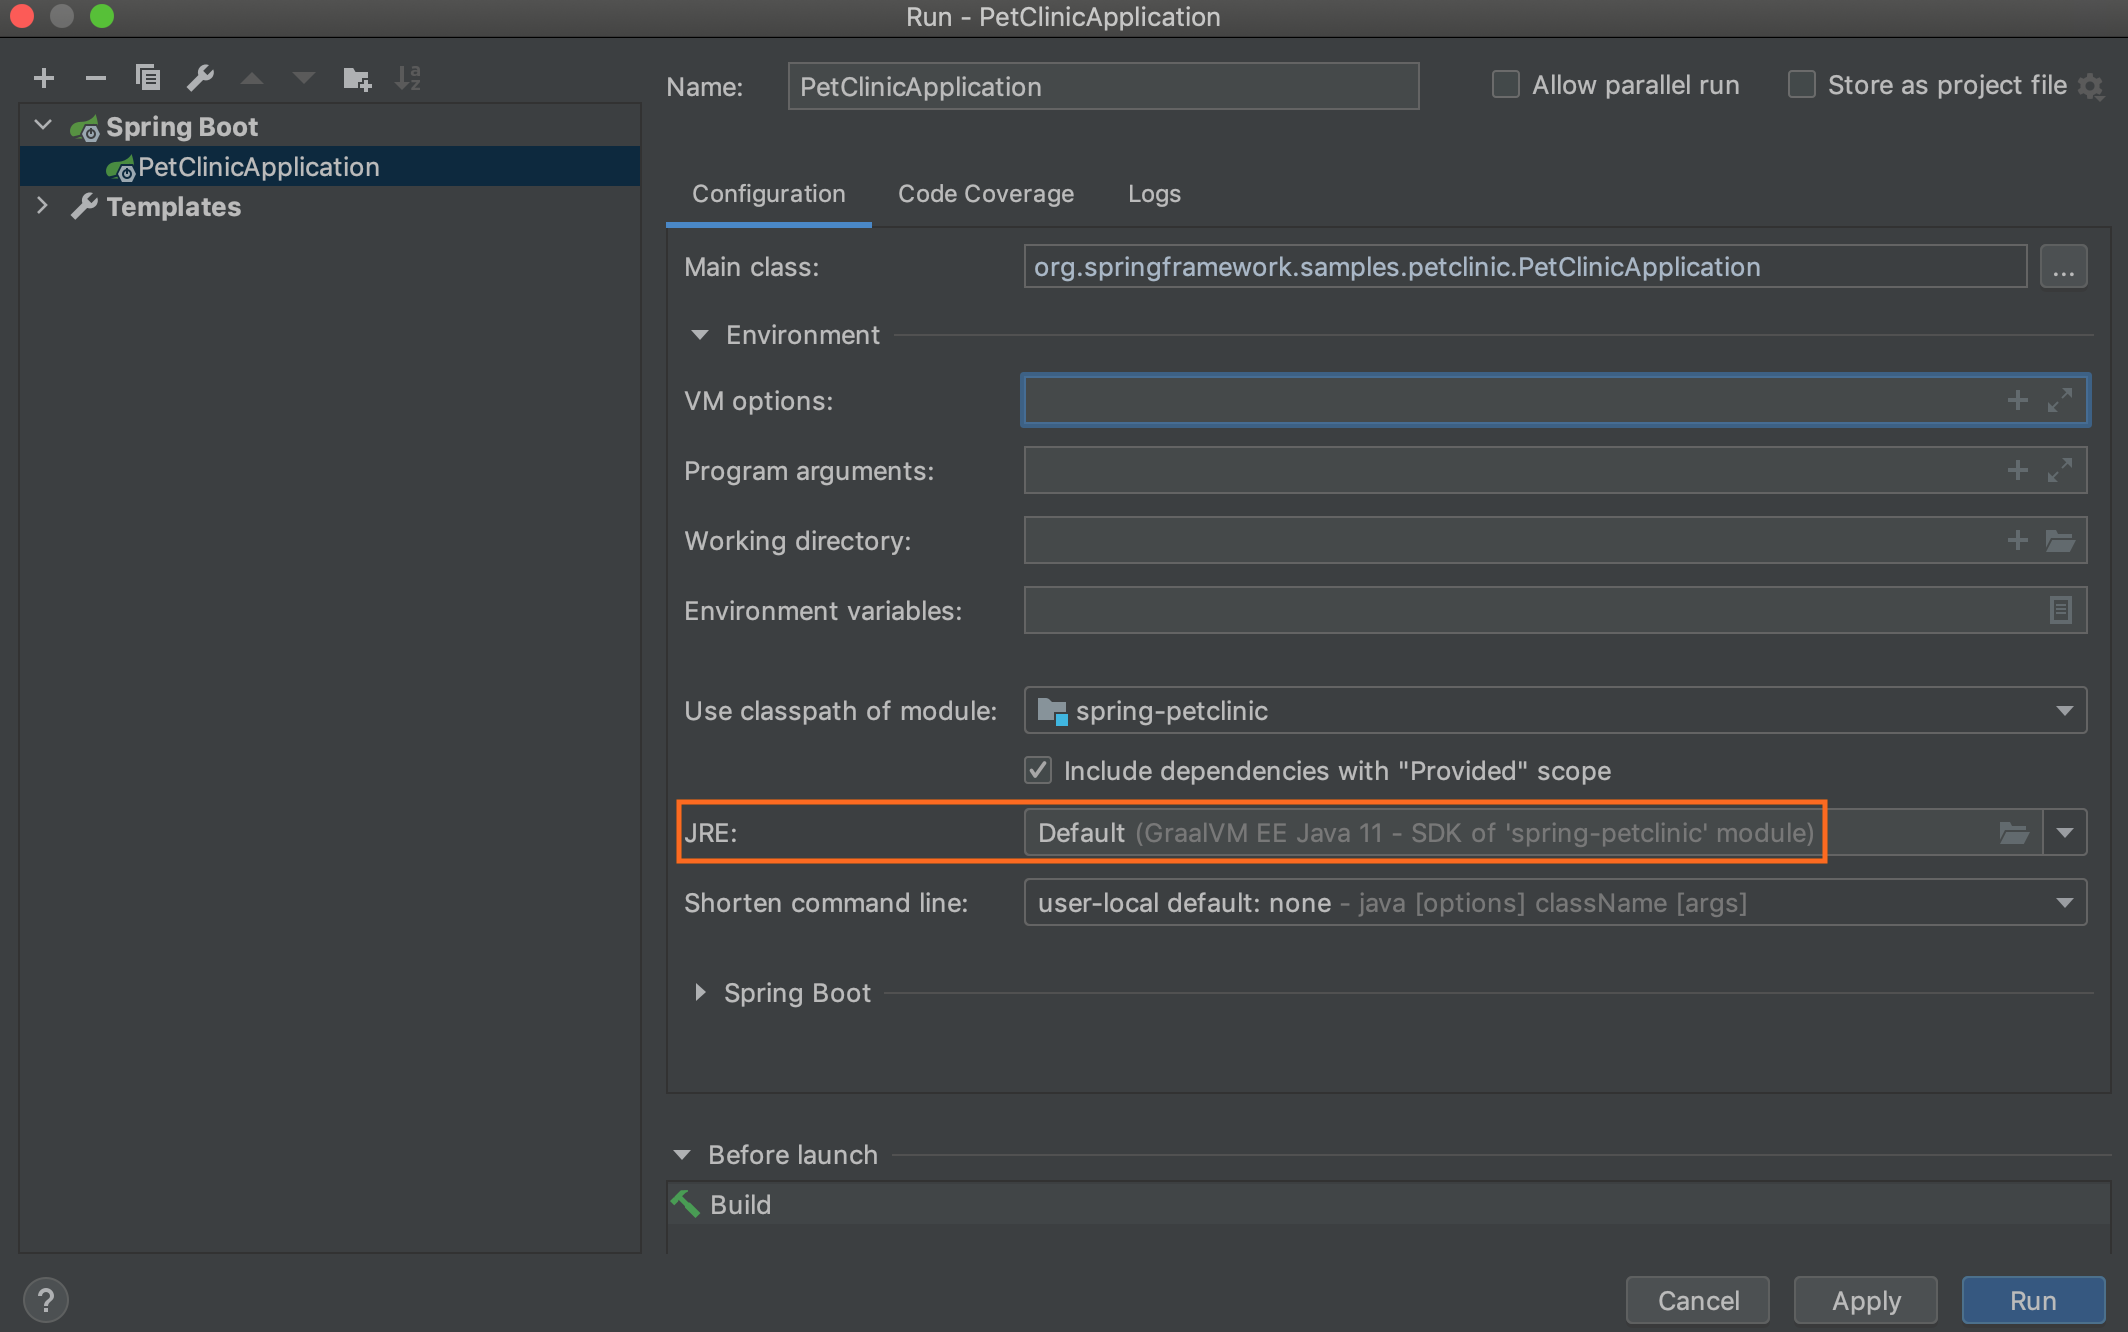
4. Run the project. Setting GraalVM SDK as default for all project modules ensures that you run the project on GraalVM. To double-check that, verify the project’s Run configurations: from the main menu select Run -> Run… -> Edit Configurations, expand Environment, and check the provided value. It should show GraalVM. Press Run.
Debug Java Applications on GraalVM from an IDE
You can use your IDE debugger to debug applications running on GraalVM. In the previous section you added GraalVM as the project’s default SDK and ran the sample application from IntelliJ IDEA. You do not have to configure anything specific to start a debugger session from IntelliJ IDEA now, as it is based on the Run configurations. To ensure you attach the debugger to your Java application in the same environment, navigate in the main menu to Run -> Debug… -> Edit Configurations, expand Environment and check the JRE value. It should show GraalVM. Press Debug.
This will run the application and start a debugger session in the background.
Configure JVM Options for Applications Running on GraalVM
You can use Java HotSpot VM command line options and GraalVM specific options to configure the java process running on GraalVM.
If you are running the application from the command line, you need to add the options to the java command.
In the IDE, use the IDE specific way to provide the options.
For example, you might want to allocate larger memory when starting an application.
In Intellij IDEA you can enter the -Xmx1024m -Xms256m values in the VM options field under Run -> Run… -> Edit Configurations -> Environment.
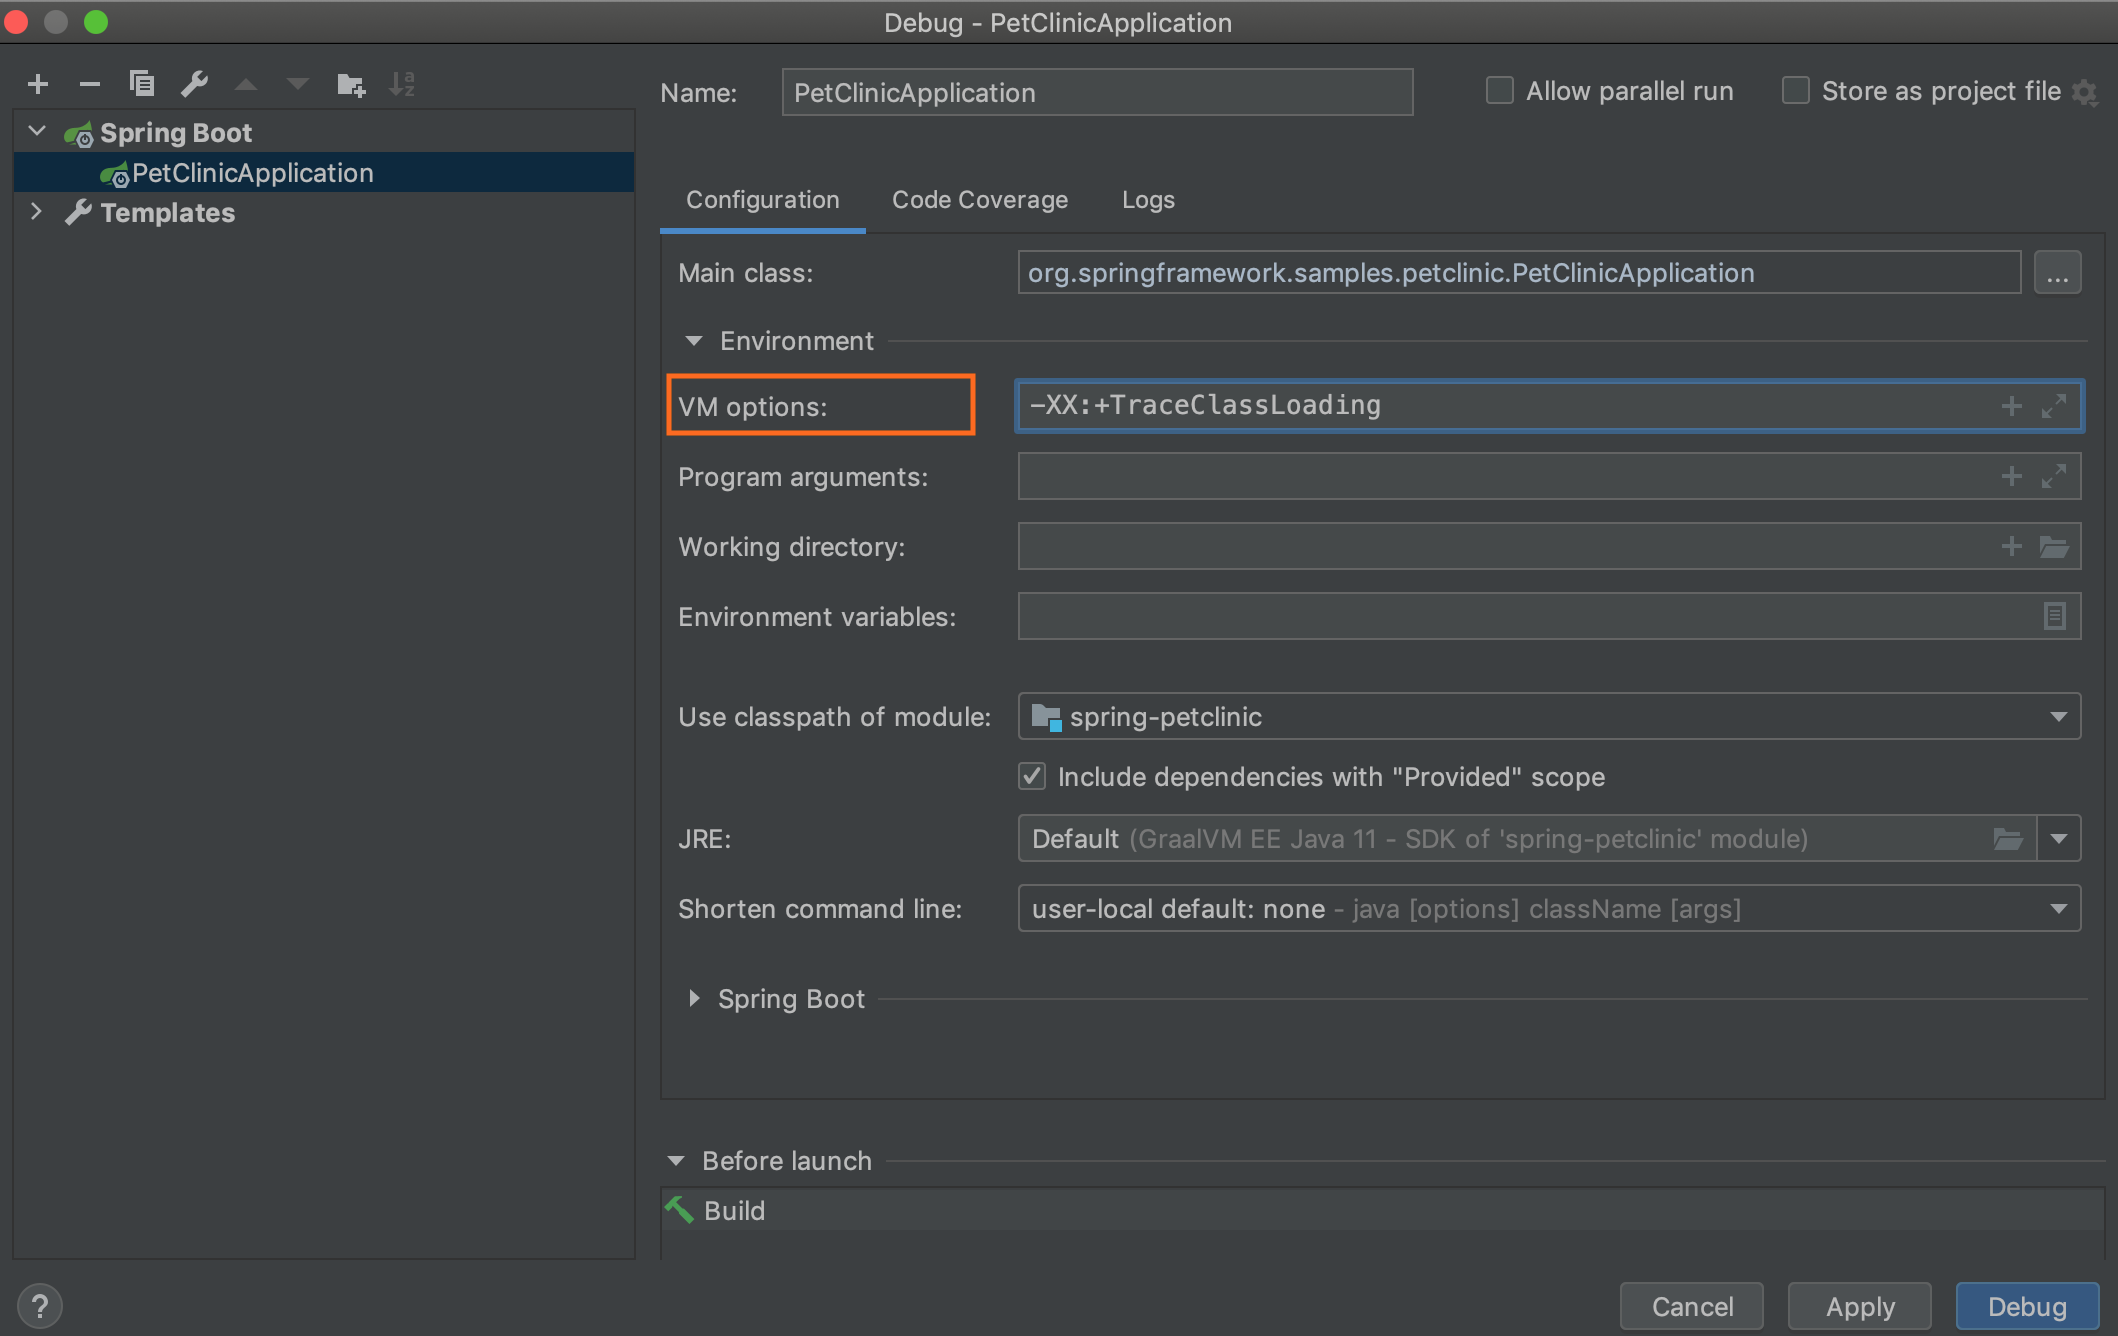
Or, for example, you want to print the list of classes loaded.
Then pass the -XX:+TraceClassLoading option under Run -> Run… -> Edit Configurations -> Environment -> VM options, and launch the application.
Since you are running on GraalVM, you can use GraalVM specific options, for example, passing -XX:+EagerJVMCI -Dgraal.PrintConfiguration=info will gather information about the compiler configuration selected to the console, and then exit the program.
Profile Java Applications on GraalVM with VisualVM
You can profile a Java application from an built-in profiler in your IDE, but this guide shows how to apply VisualVM instead. VisualVM is a Java profiling tool shipped with GraalVM. It includes heap analysis features, allows you to measure the methods of your Java application, analyze objects, read JFR snapshots, and so on.
You can start VisualVM in two ways:
- Download it as a standalone tool from here and launch.
- Since you have GraalVM installed and VisualVM is bundled with it, start it simply from the command line:
jvisualvm
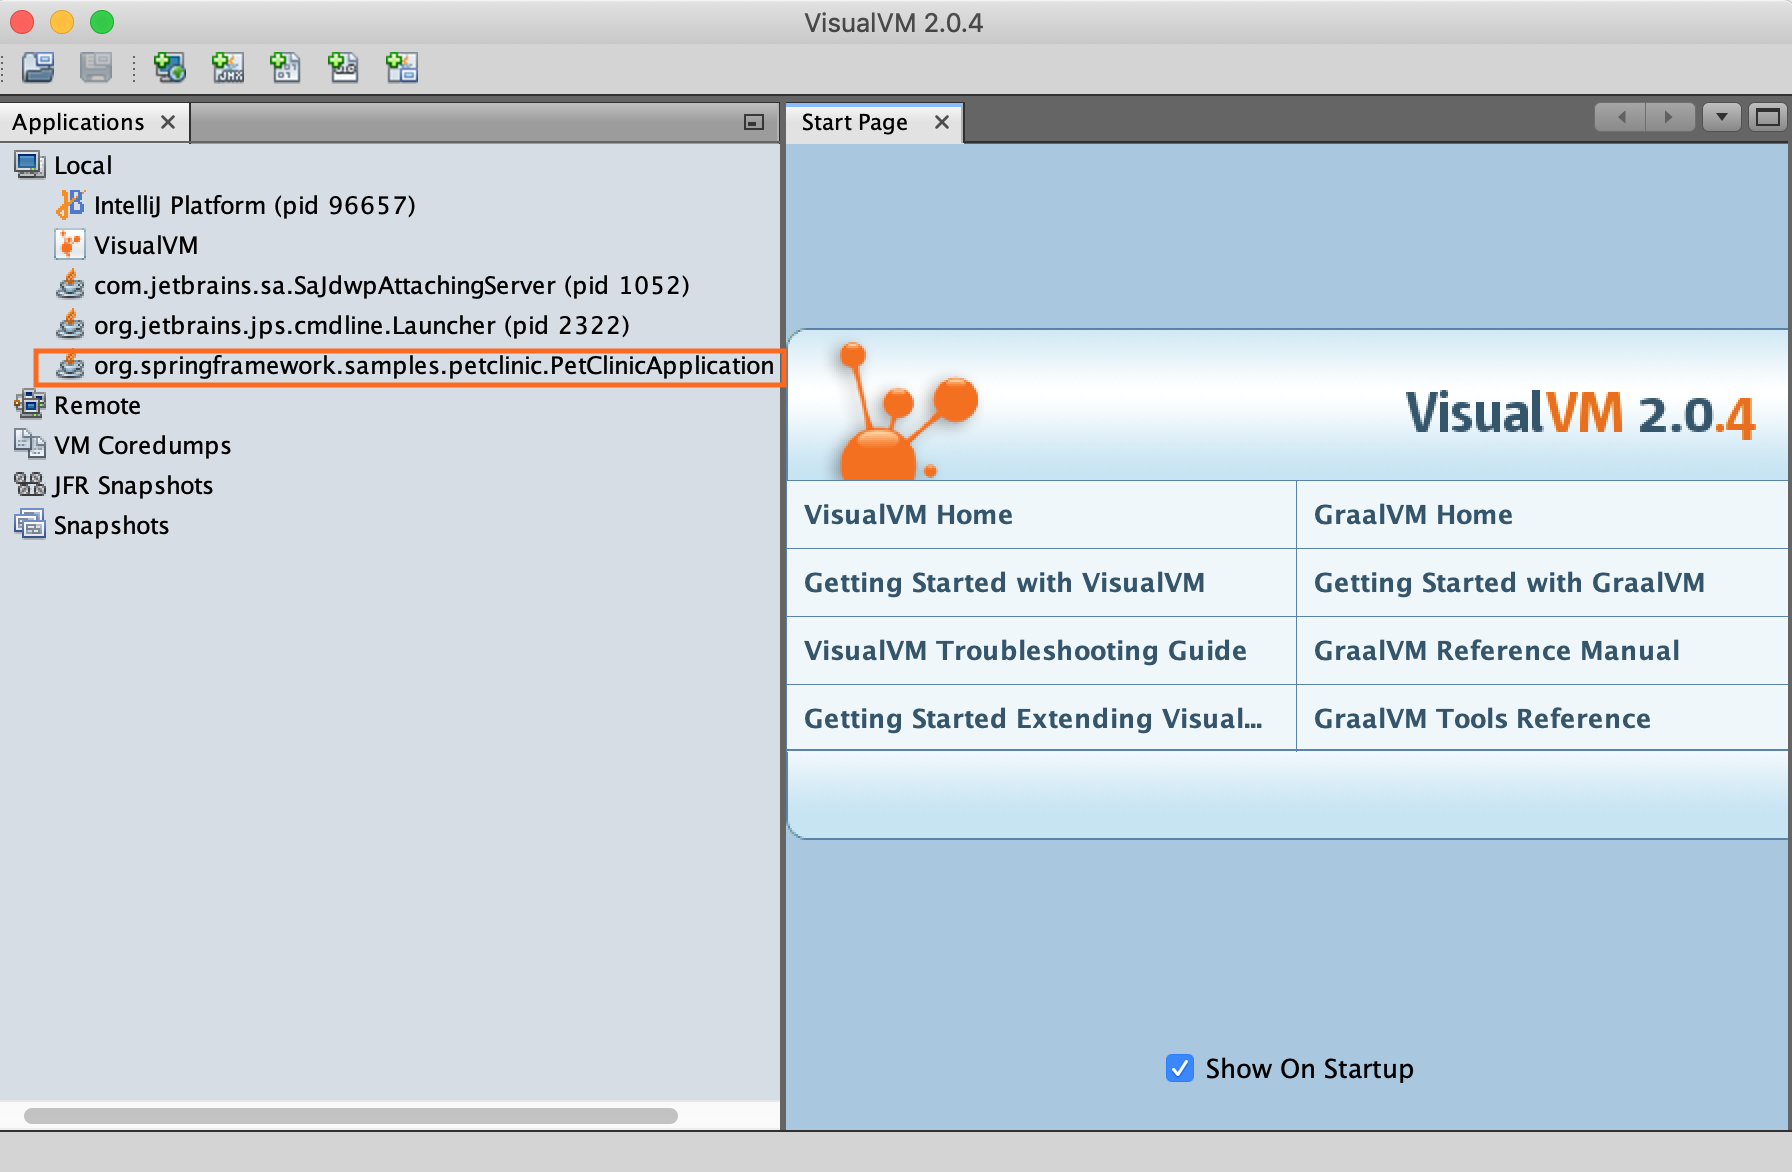
Immediately after startup, the tool shows all locally running Java processes in the Applications area, including the VisualVM process itself. To connect to an application running on GraalVM (or another JDK), find it in the processes list.
VisualVM enables instrumented profiling of local Java applications from their startup. It is also helpful when profiling short-running processes.
If you suspect that you have memory constraint problems, VisualVM is exactly the right tool to investigate those.
First, to confirm that you really have a memory leak, enable verbose garbage collection (--verbosegc) when starting the application.
Next, connect VisualVM to a running Java application and apply the profiler.
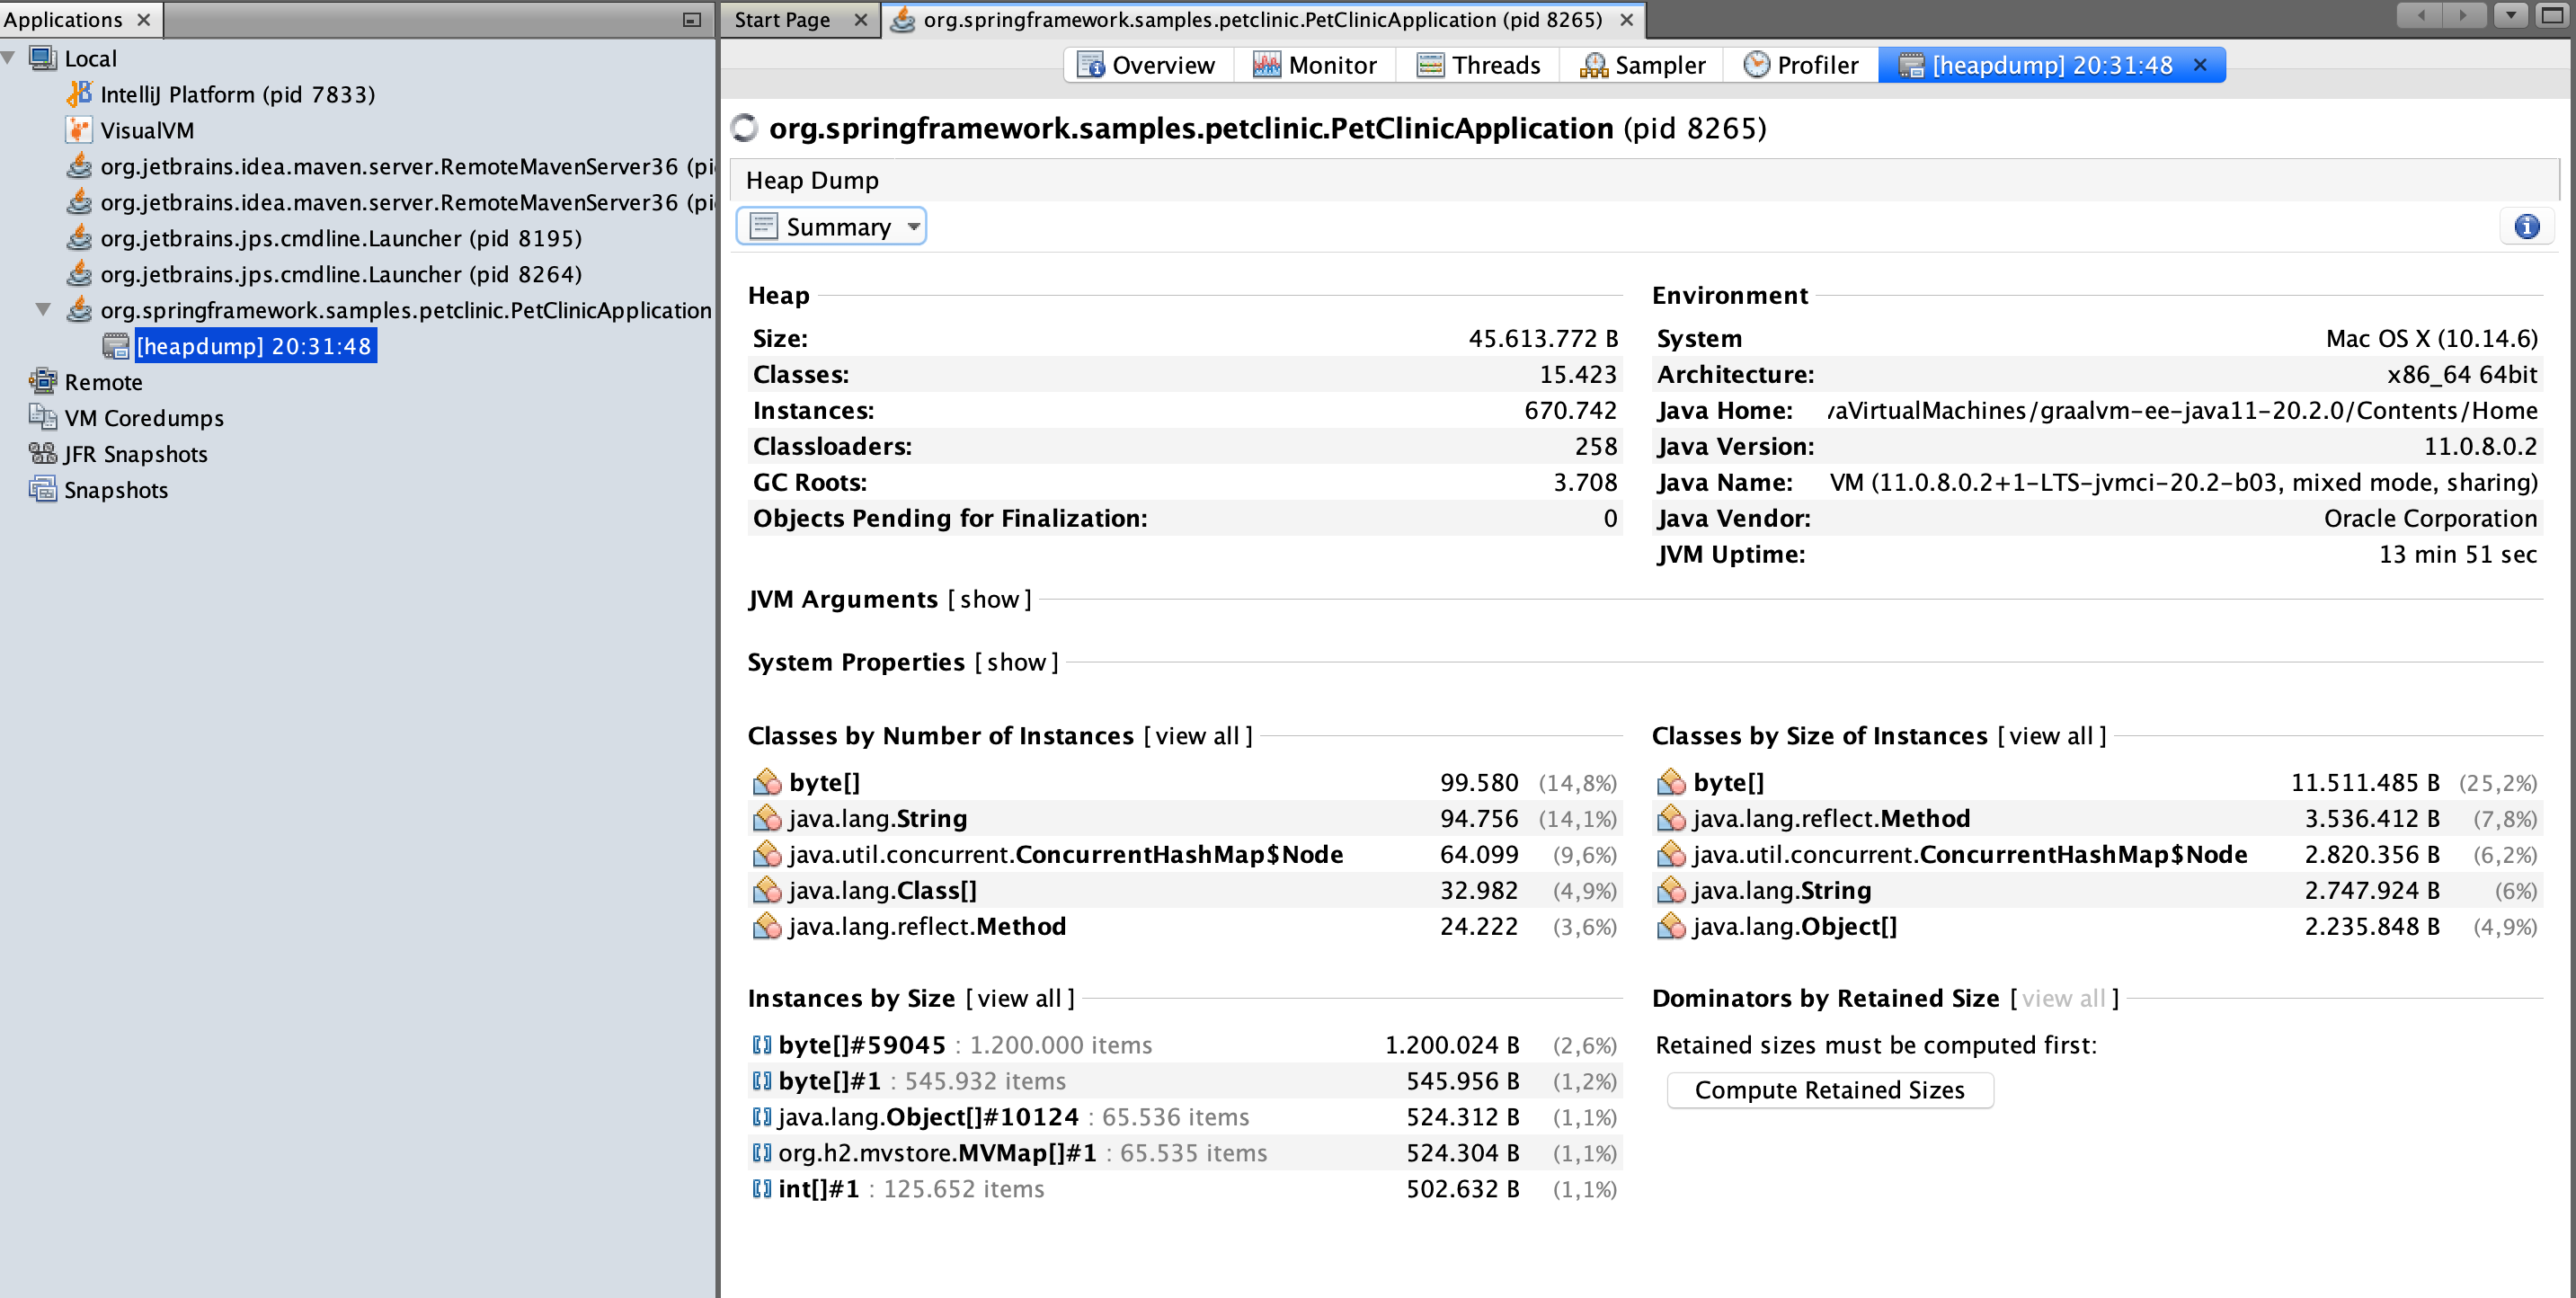
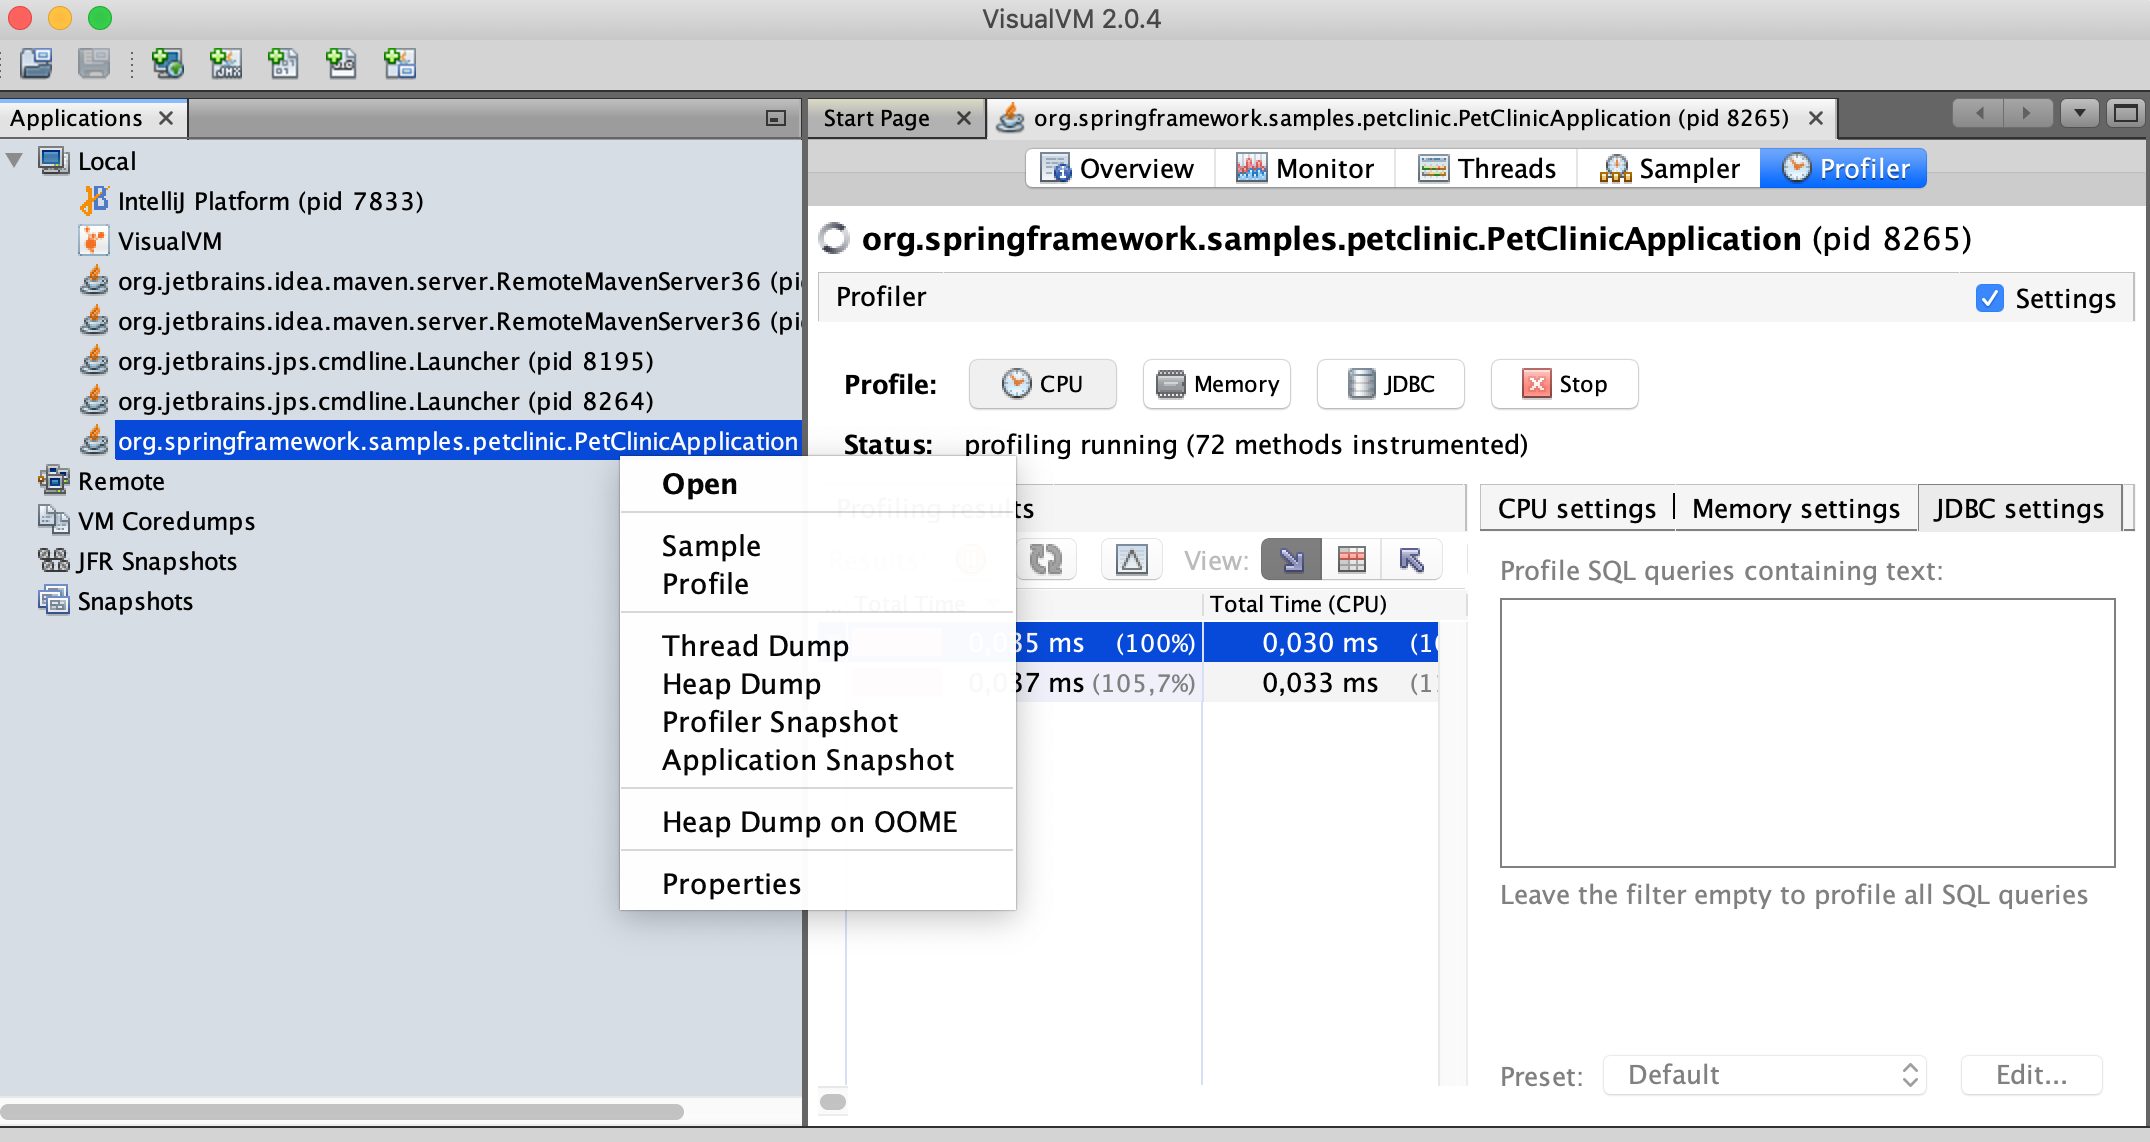
When the profiling session starts and the profiled application opens in VisualVM, you can see the live profiling data.
To view call trees for CPU data and stack traces for memory allocations, take a snapshot: right-click the application process in VisualVM and invoke the Heap Dump action.
A heap dump typically includes detailed information about the type and size of objects.
Now you can start analyzing stack traces. Find a block of objects in the heap that should not be there and determine if these objects accumulate instead of get released. Check the transient objects, allocated every time a certain event is triggered in the Java application. If there are too many object instances, that may indicate an application bug. For more information on using VisualVM, check its official documentation.